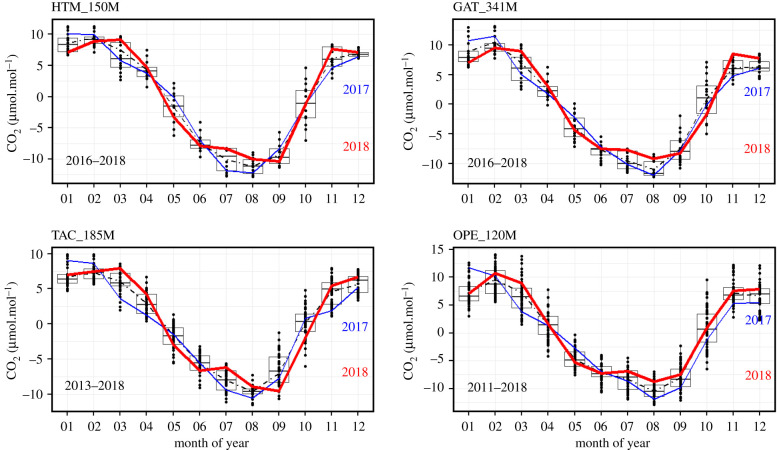
Figure 4.
CO2 seasonal cycles observed at Hyltemossa (HTM, Sweden), Gartow (GAT, Germany), Tacolneston (TAC, UK) and Observatoire Pérenne de l'Environnement (OPE, France). The 2018 cycle is shown in red, 2017 in blue, and a statistical summary of the full measurement period as box-and-whisker plots showing the median, first and third quartiles over the entire measurement period of each station, indicated in the bottom left corners of the plots. Corresponding figures for all other stations are shown in electronic supplementary material, figure S2. (Online version in colour.)

