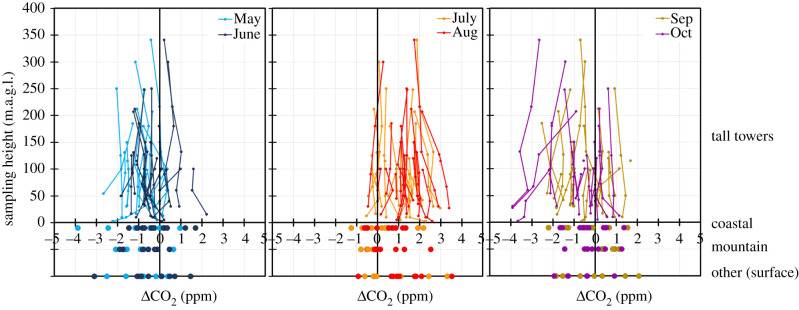
Figure 5.
Monthly mean CO2 differences anomalies for each month during May to October 2018, compared to the same month during previous years, the data being available from 2009 to 2018 with variable coverage between stations, i.e. CO2 (2018) minus CO2 (previous years). Upper panel shows the vertical profile of tall towers, whereas the bottom panel shows separately coastal, mountain and other surface sites. (Online version in colour.)

