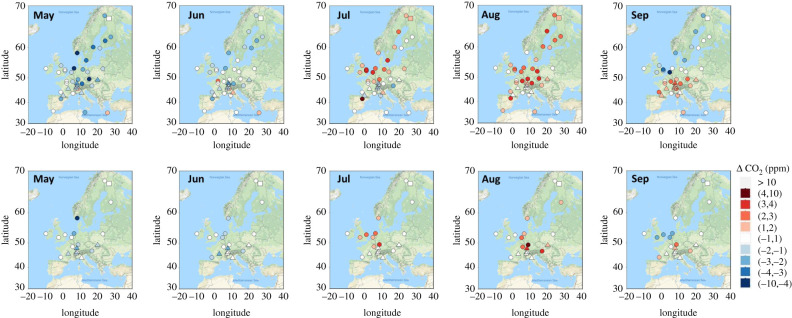
Figure 8.
Map of the monthly mean CO2 differences (2018 minus 2017) from May (left) to September (right). Circles represent surface stations in lowlands. Triangles indicate the mountain sites, and the square indicates a total column measurement station (TCCON). Top panels show the differences for 2018 minus 2017. Bottom panels show differences for 2018 minus 2010–2017 mean. (Online version in colour.)

