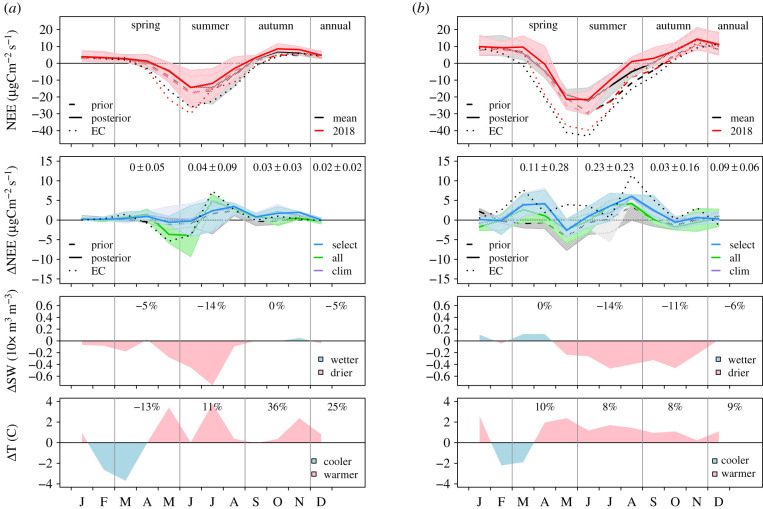
Figure 3.
(a) Monthly mean NEE and NEE anomaly, and monthly anomalies in SW and T for the North region. For NEE, the mean of all months 2009–2018 is shown in black and the mean for 2018 is shown in red. The NEE anomaly is for 2018 compared to the mean 2009–2018 and is shown for the three inversion cases (select, all and clim) by the solid lines and the range of all inversions in each case is shown by the shading. The numbers give the ensemble mean and s.d. for the seasonal and annual anomalies in Pg C yr−1. For both NEE and NEE anomaly, the mean of prior NEE models, VPRM, SiBCASA and LPJ-GUESS (dashed line) and mean NEE from EC sites (dotted line) are also shown. For the NEE anomaly, we also show the range of the prior NEE models (grey shading). The anomalies in SW and T are for 2018 compared to 2009–2018 and the numbers give the percentage anomaly for each season and annually. (b) Similar to (a) but for the Temperate region.

