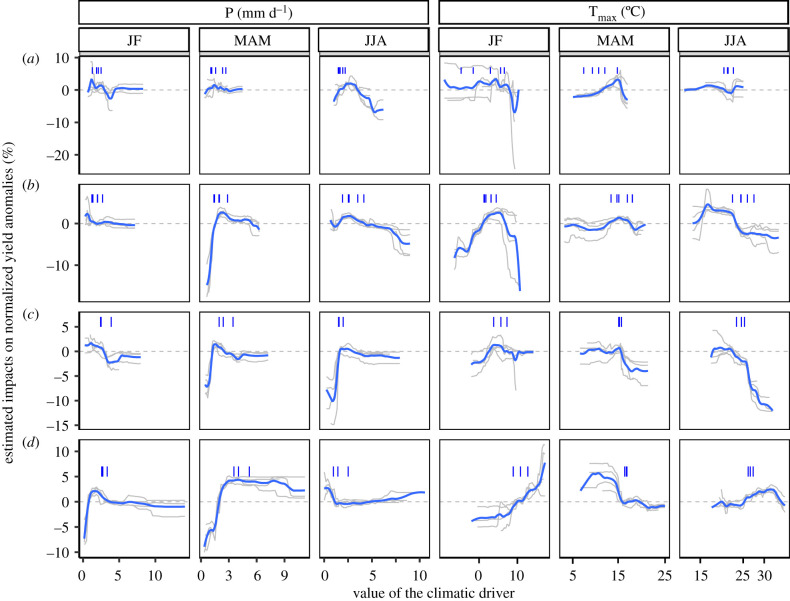
Figure 2.
Estimated impacts of main climate drivers on cereal (i.e. barley, oats, triticale, rye, wheat) yield anomalies in four European regions: Northern Europe (a), Eastern Europe (b), Western Europe (c) and Southern Europe (d). Grey curves correspond to the effects of each cereal crop estimated independently by random forests based on historical times series. Only the six main drivers are presented in this plot (P, rainfall; Tmax, maximum temperature; JF, January–February; MAM, March–April–May; JJA, June–July–August). Blue curves correspond to a loess fit over all crops. Blue segments correspond to the experienced values of climate drivers in 2018 for each country within each region. (Online version in colour.)

