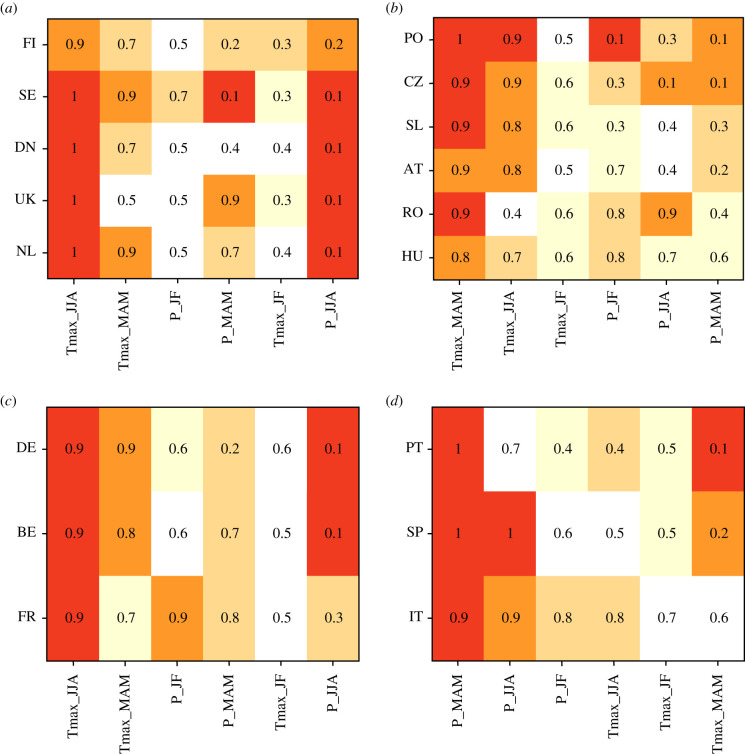
Figure 7.
Percentiles of the climate anomalies in 2018 in various countries of four European sub-regions: (a) Northern, (b) Eastern, (c) Western and (d) Southern Europe. Only the six climate drivers that most impacted yields are shown (abscissa). Names of the countries (ordinates) are described in electronic supplementary material, figure S1. The climatic drivers are ranked by decreasing mean values (across countries) within each European sub-region. A percentile of 0.9 indicates that the value of the climatic variable is observed, on average, every 10 years. The higher (lower) the anomaly, the darker (lighter) the colour of the cell. (Online version in colour.)

