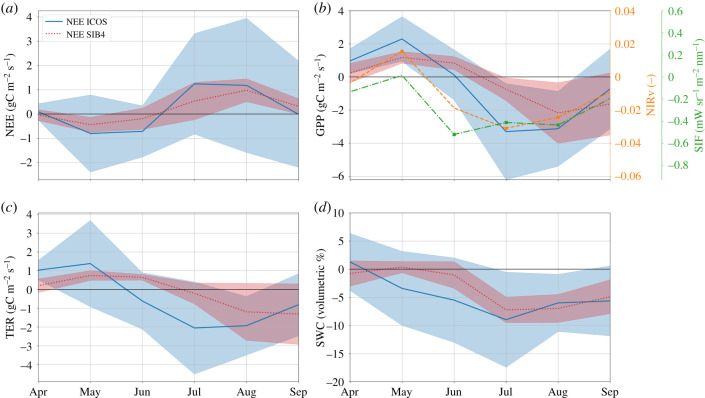
Figure 2.
SIF, NIRv and modelled and measured NEE (a), GPP (b), TER (c) and SWC (d) anomalies of 2018 against the climatological average (2013–2017) for the seven forest sites (four deciduous broadleaf and three evergreen needleleaf). The average over the different sites is shown together with the 1σ spread around the mean. The modelled GPP (SiB4) represents the same PFT as that at the measurement location. SIF and NIRv products are taken from the satellite pixel in which the ICOS measurement site is located and anomalies that exceed 1σ are indicated with a cross symbol. Soil moisture is derived from ecosystem site measurements taken in the top 0.05 m of the soil and from the uppermost layers 1–3 of the hydrological component of SiB4. (Online version in colour.)

