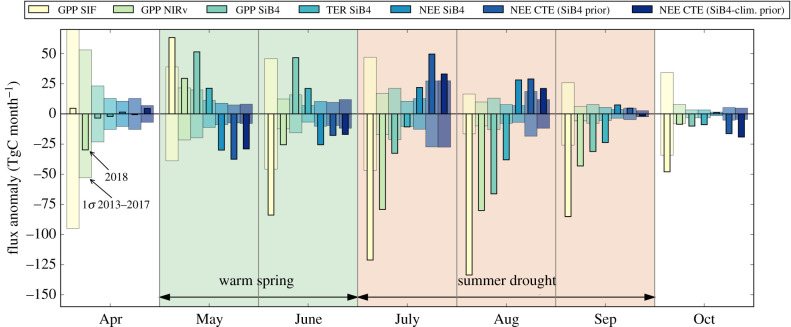
Figure 4.
The monthly mean 2018 anomalies compared with the 2013–2017 mean integrated across the 2σ precipitation drought mask for: SIF-derived GPP, NIRv-derived GPP, SiB4 GPP, SiB4 respiration (TER), SiB4 NEE, and optimized NEE from CTE from two simulations—one using SiB4 NEE as a prior and the other using the 5-year climatology of SiB4 NEE as a prior. Thinner solid bars show the 2018 anomalies and the wider transparent bars show the 1σ standard deviation of the 2013–2017 mean. (Online version in colour.)

