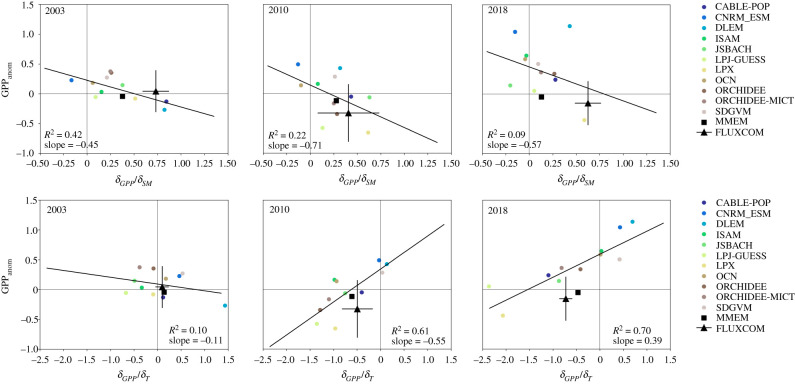
Figure 2.
Simulated GPPanom by DGVMs and their sensitivities to SM (top) and temperature (T, bottom) compared to those from the data-driven product FLUXCOM. The markers show the values for individual DGVMs (coloured circles) and the MMEM (black square). The black line indicates the linear regression fit for the individual DGVM estimates, and the labels indicate the corresponding slope and R2-values. The mean value of the 6-member ensemble from FLUXCOM is indicated by the triangle, and the ±1σ range by the error bars. (Online version in colour.)

