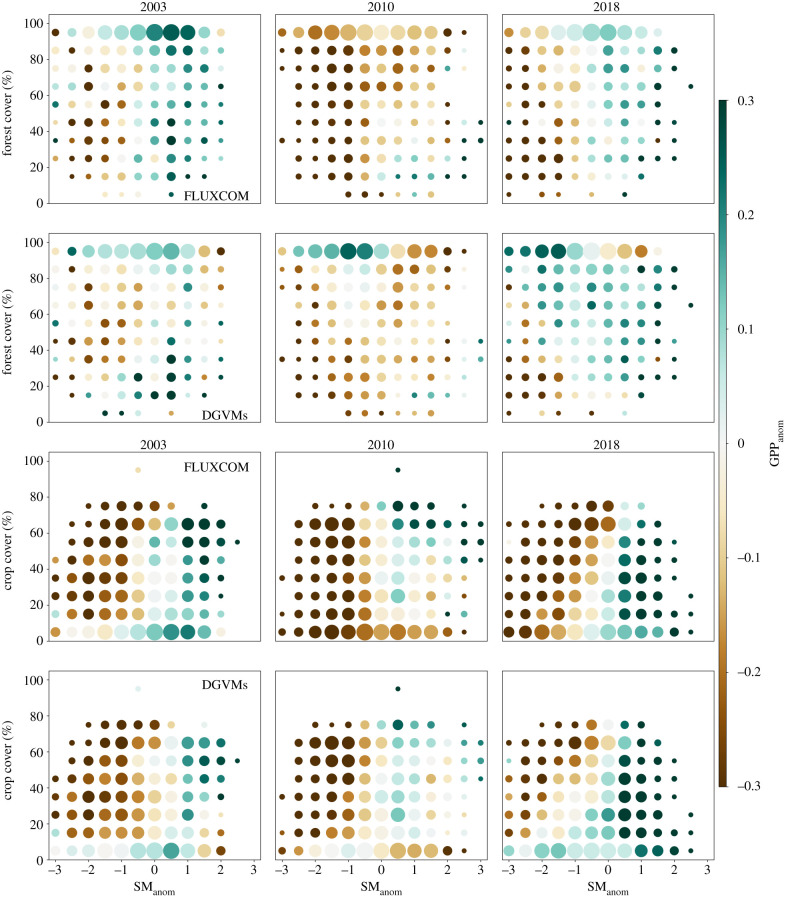
Figure 3.
Impact of the DH events (left 2003, middle 2010, right 2018) in different land-cover types. The standardized GPPanom (colourmap) for the data-driven FLUXCOM product and for the MMEM of DGVMs are shown for different bins of SManom and of forest (two top rows) and cropland (two bottom rows) cover fractions. The size of the markers is proportional to the number of pixels within a given class (all years have the same total number of pixels, corresponding to the land area). (Online version in colour.)

