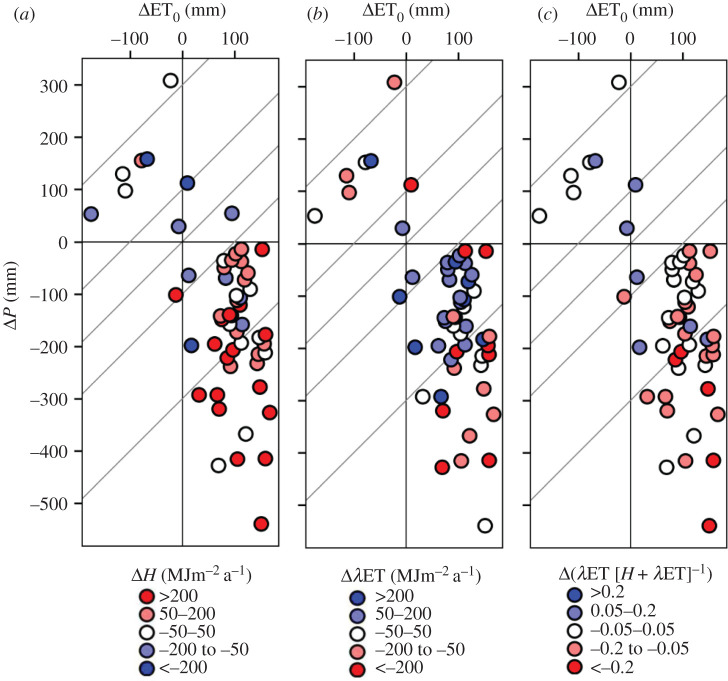
Figure 2.
Annual 2018 anomalies of sensible heat flux (H) (a), latent heat flux (λET) (b), and evaporative fraction (λET (H + λET)−1) (c) as a function of precipitation P and grass reference ET0 deficits. Diagonal isolines indicate P-ET0 anomalies of 0, ±100 and ±300 mm (figure 1).

