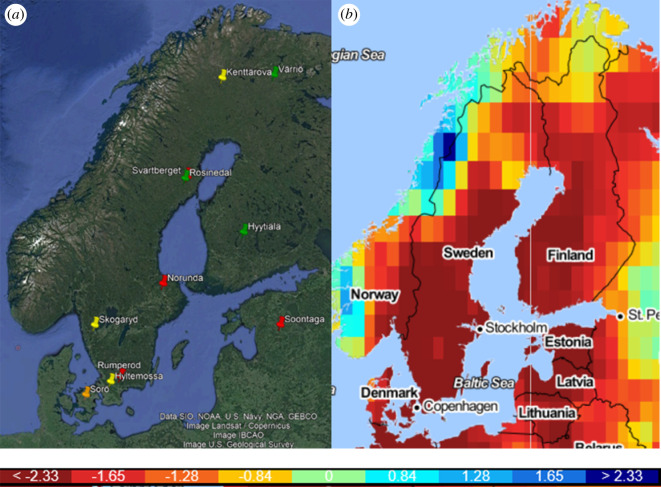
Figure 1.
(a) Geographic locations of flux sites; spruce—yellow, pine—green, mixed forests—red and beech—orange. (b) Map of SPEI 6-month drought index from Global Drought Monitor (https://spei.csic.es/map/maps.html) [21] during the summer of 2018 (April–September). Bottom: SPEI drought scale where dark red is the most severe drought conditions. (Online version in colour.)

