Figure 10.

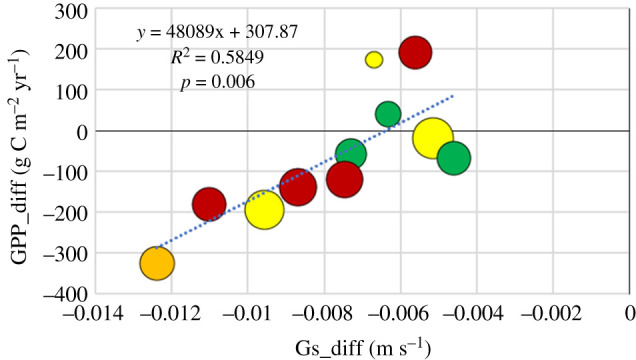
The anomaly in gross primary productivity, GPP_diff, plotted against the anomaly in surface conductance, Gs_diff. Symbols as in figure 8. (Online version in colour.)

The anomaly in gross primary productivity, GPP_diff, plotted against the anomaly in surface conductance, Gs_diff. Symbols as in figure 8. (Online version in colour.)