Figure 3.

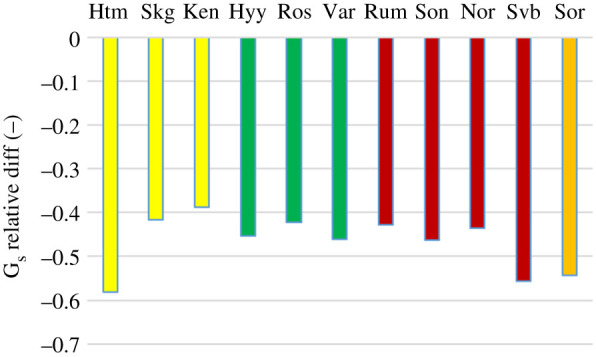
The relative difference in mean growing season surface conductance (Gs) between year 2018 and reference year. Colour code as in figure 2. (Online version in colour.)

The relative difference in mean growing season surface conductance (Gs) between year 2018 and reference year. Colour code as in figure 2. (Online version in colour.)