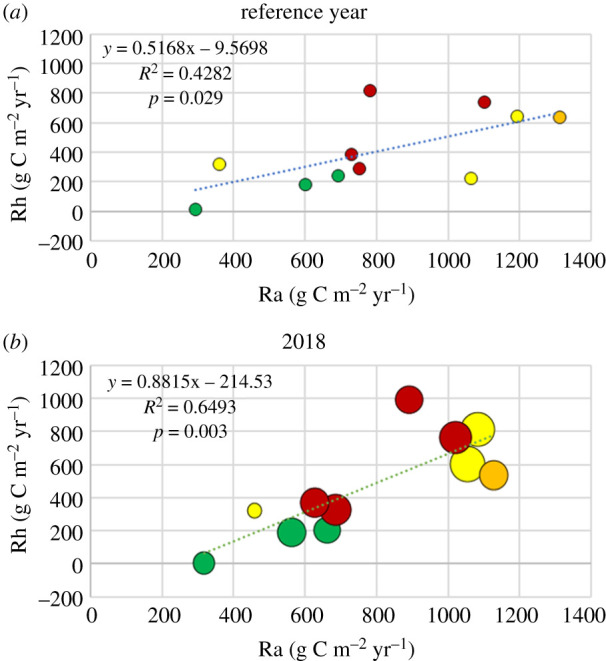
Figure 7.

(a) Heterotrophic respiration (Rh) plotted against autotrophic respiration (Ra) for the respective reference year (see electronic supplementary material Table S2). (b) Similar plot but for the year 2018. The colour code as in figure 2. The size of the symbols for 2018 corresponds to the magnitude of the relative precipitation deficit (see also legend in figure 8). (Online version in colour.)
