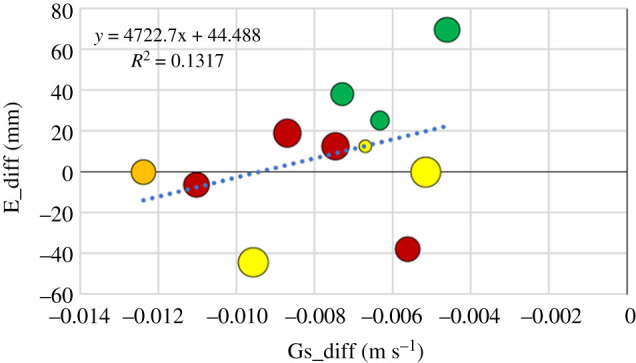
Figure 8.

Evaporation difference (E_diff) plotted against the surface conductance difference (Gs_diff). The size of the symbols is proportional to the relative precipitation deficit, RPD (table 1). The largest symbol corresponds to RPD= 0.55 (Skogaryd) and the smallest corresponds to RPD=0.1 (Kenttärova). The colour of the symbols represents the different forest types (see legend in figure 2). (Online version in colour.)
