
Figure 9.
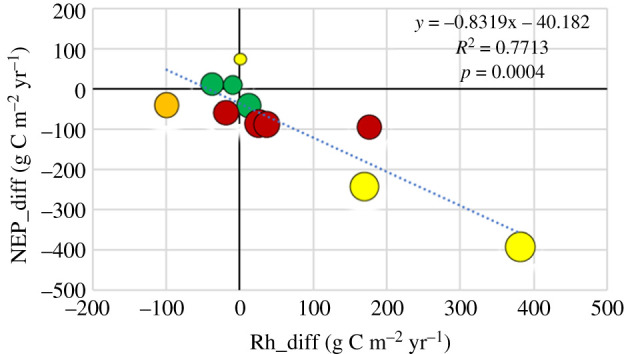
The anomaly in net primary productivity, NEP_diff, plotted against the anomaly in heterotrophic respiration, Rh_diff. Symbols as in figure 8. (Online version in colour.)
Official websites use .gov
A
.gov website belongs to an official
government organization in the United States.
Secure .gov websites use HTTPS
A lock (
) or https:// means you've safely
connected to the .gov website. Share sensitive
information only on official, secure websites.
The anomaly in net primary productivity, NEP_diff, plotted against the anomaly in heterotrophic respiration, Rh_diff. Symbols as in figure 8. (Online version in colour.)