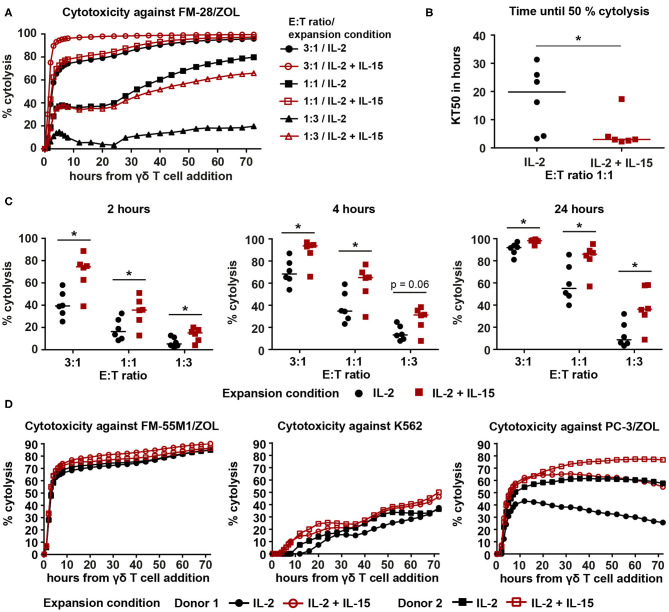
Figure 2.
IL-2/IL-15-expanded Vγ9Vδ2 T cells show enhanced cytotoxicity against various cancer cell lines in a 72-h xCELLigence real-time cell analysis assay. (A) Representative cytolysis plot, comparing Vγ9Vδ2 T cell ability to kill FM-28/ZOL between the two expansion conditions. The experiment was conducted at three different effector–target cell ratios (3:1, 1:1, 1:3). Black symbols belong to IL-2-expanded cultures, whereas red symbols indicate IL-2/IL-15-expanded cultures. Lines represent means of three technical replicates. (B) Time to kill 50% of the target tumor cells (KT50) was compared between both expansion conditions at an effector–target cell ratio of 1:1. Horizontal lines depict the median KT50 of the respective expansion conditions (n = 6, compiled from two independent experiments, γδHD7–12). (C) Comparison of percentage of cytolysis at time points 2, 4, and 24 h after addition of IL-2-expanded vs. IL-2/IL-15-expanded Vγ9Vδ2 T cells. Percentage of cytolysis is shown for different effector–target cell ratios. Horizontal lines indicate median cytolysis (n = 6, compiled from two independent experiments, γδHD7–12). (D) Cytolysis plots comparing Vγ9Vδ2 T cell ability to kill FM-55M1/ZOL (left plot), K562 (middle plot), and PC-3/ZOL (right plot) between expansion conditions. Cytotoxicity was assessed at an effector–target cell ratio of 1:1 for FM-55M1/ZOL and PC-3/ZOL and at a ratio of 3:1 for K562. Black, filled symbols indicate IL-2-expanded cultures, whereas matching red, empty symbols indicate the associated IL-2/IL-15-expanded cultures (n = 3 with n = 2 per cell line, compiled from two independent experiments; γδHD9,10,12). % cytolysis and KT50 were calculated using the xCELLigence RTCA Software Pro (ACEA Biosciences). Statistical significance was determined with the Wilcoxon matched-pairs signed-rank test. *p < 0.05. FM-28, FM-55M1 = melanoma cell lines. K562 = chronic myelogenous leukemia cell line. PC-3 = prostate cancer cell line. /ZOL = 24-h-pre-stimulation with ZOL.

