Fig. 1.
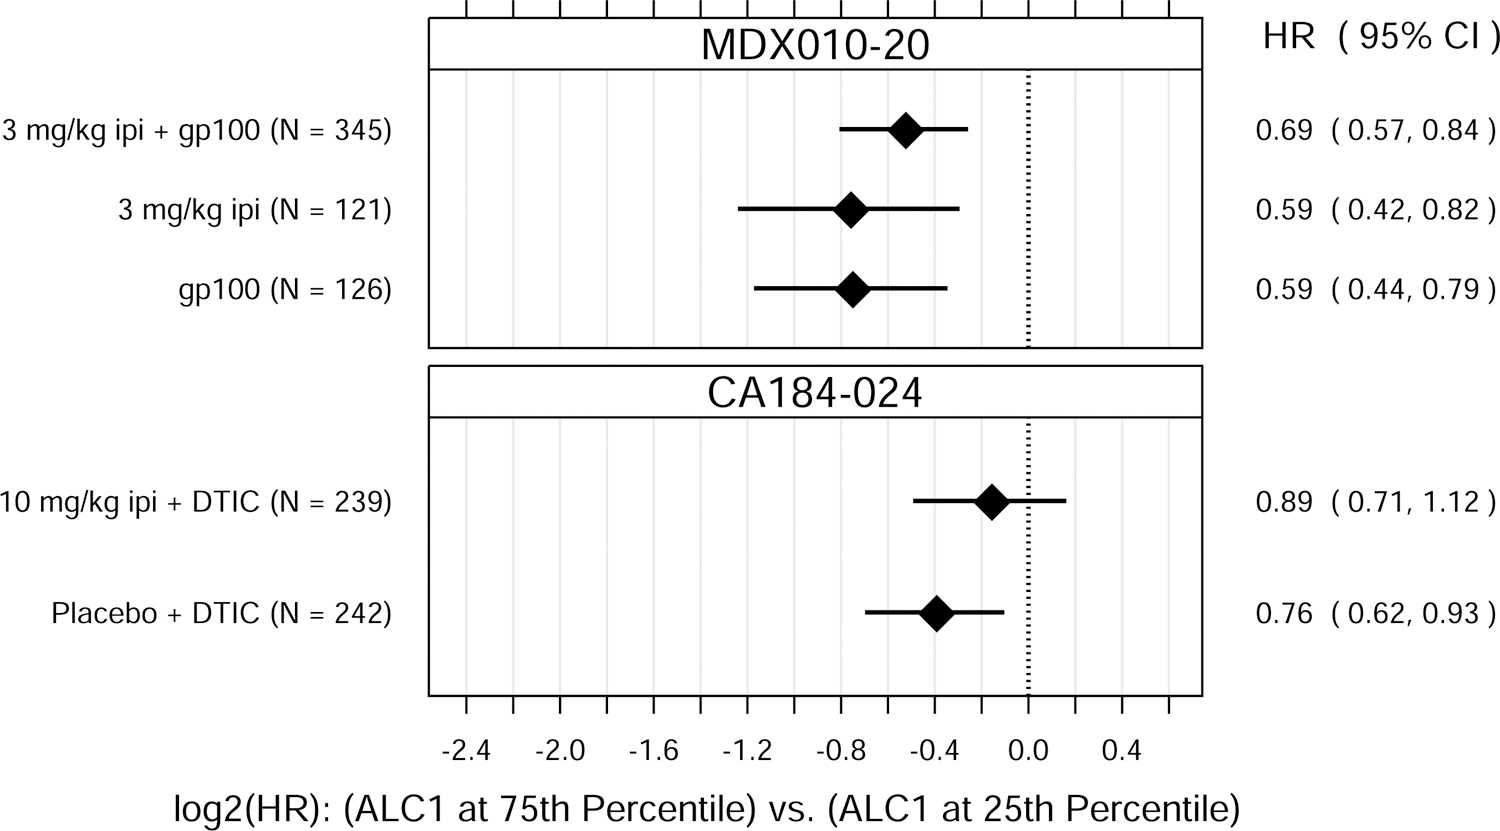
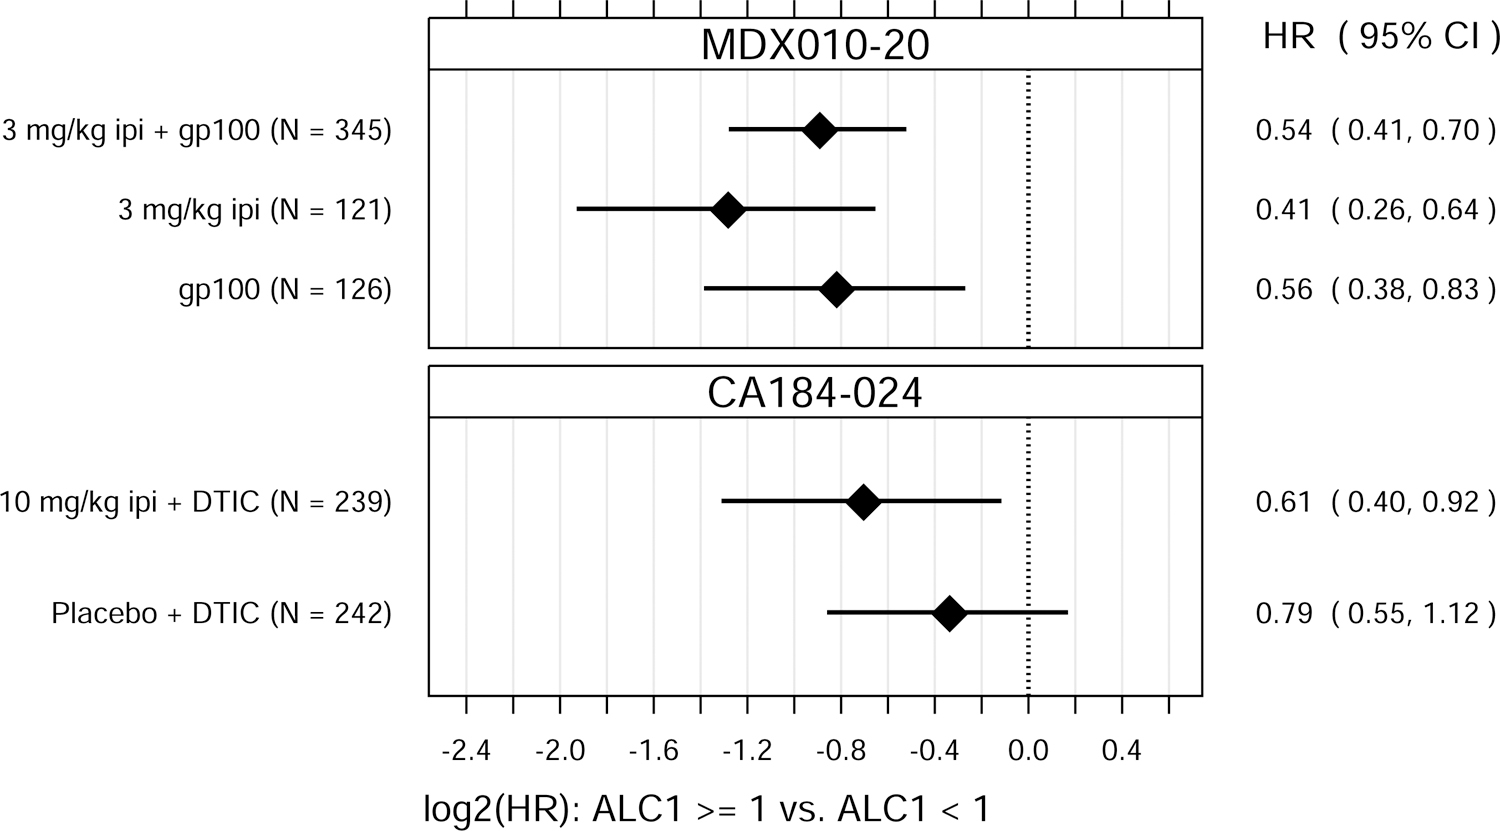
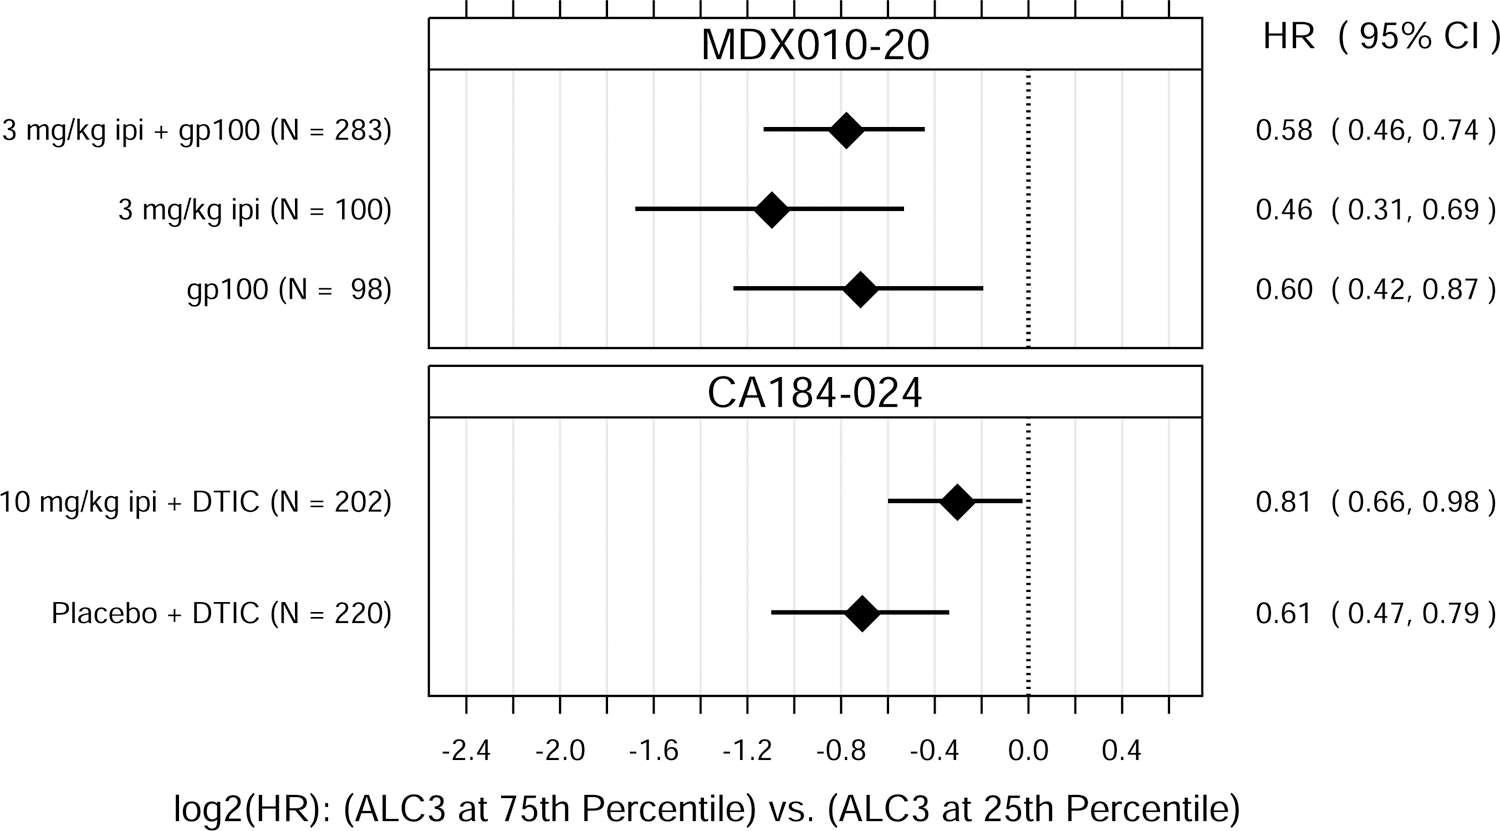
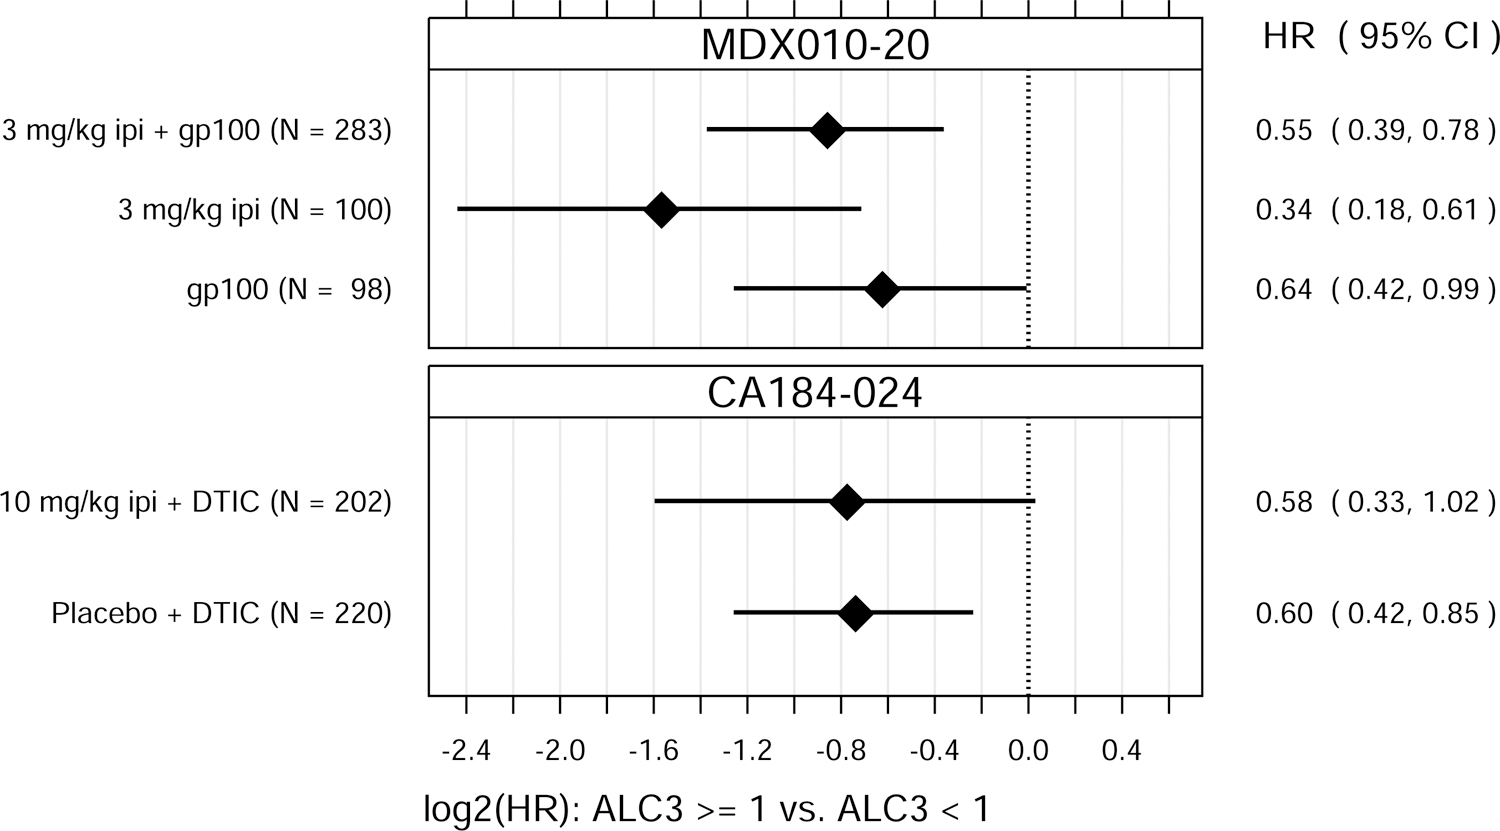
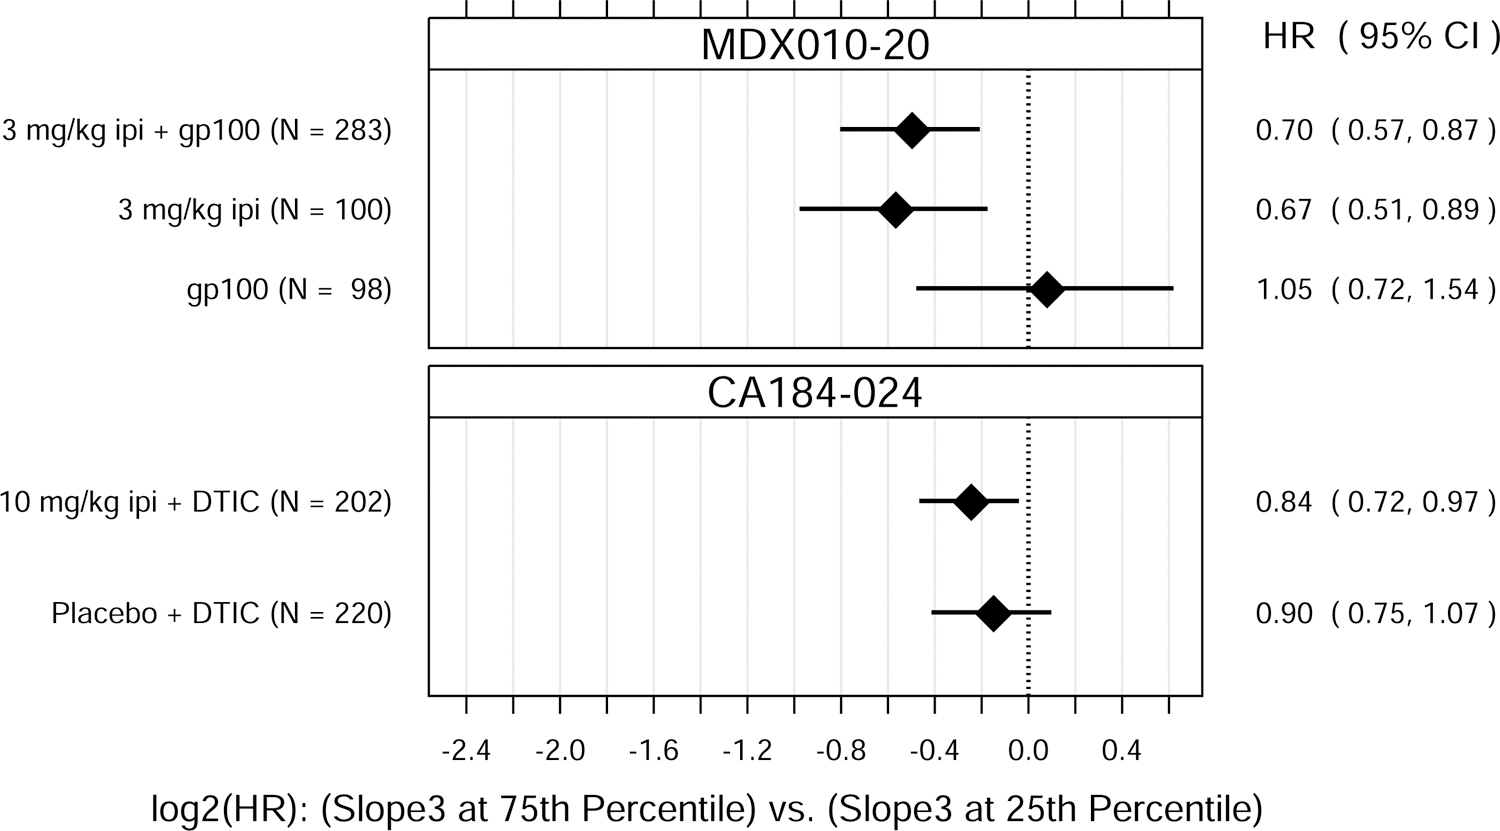
Hazard ratio (HR) estimates from Cox PH models, for each treatment group in each trial. HR estimates compare OS hazards for (A) ALC1 at the 75th and 25th percentiles; (B) ALC1 dichotomized as ≥ 1 vs. < 1 × 10⁹ cells/L; (C) ALC3 at the 75th and 25th percentiles; (D) ALC3 dichotomized as ≥ 1 vs. < 1 × 10⁹ cells/L; and (E) Slope3 at the 75th and 25th percentiles. Diamonds show point estimates. Horizontal bars show 95% confidence intervals (CI), based on Wald statistics. DTIC = dacarbazine; gp100 = glycoprotein 100 peptide vaccine; ipi = ipilimumab; N = number of patients included in the analysis per treatment group. All patients with a baseline (no more than 28 days prior to confirmed treatment initiation) and at least one post-baseline ALC evaluation were included in the ALC1 analyses. Of those patients, all with ≥ 1 ALC evaluation at least 7 days after dose 2 and prior to dose 3 were included in the ALC3 and Slope3 analyses. Percentiles are from the ALC1, ALC3, or Slope3 distributions over both trials combined. For ALC1, 25th percentile = 1.01 × 10⁹ cells/L; 75th percentile = 1.80 × 10⁹ cells/L; interquartile range = 0.79 cells/L. For ALC3, 25th percentile = 1.15 × 10⁹ cells/L; 75th percentile = 2.08 × 10⁹ cells/L; interquartile range = 0.93 cells/L. For Slope3, 25th percentile = −0.021 × 10⁹ cells/L/week; 75th percentile = 0.070 × 10⁹ cells/L/week; interquartile range = 0.091 cells/L/week. For each patient, Slope3 was estimated by simple linear regression, using all ALC assessments in the period from ALC1 to ALC3, and actual assessment dates. Examination of scaled Schoenfeld residuals suggested that the PH assumption was reasonable for all Cox PH models.
