
Fig. 3.
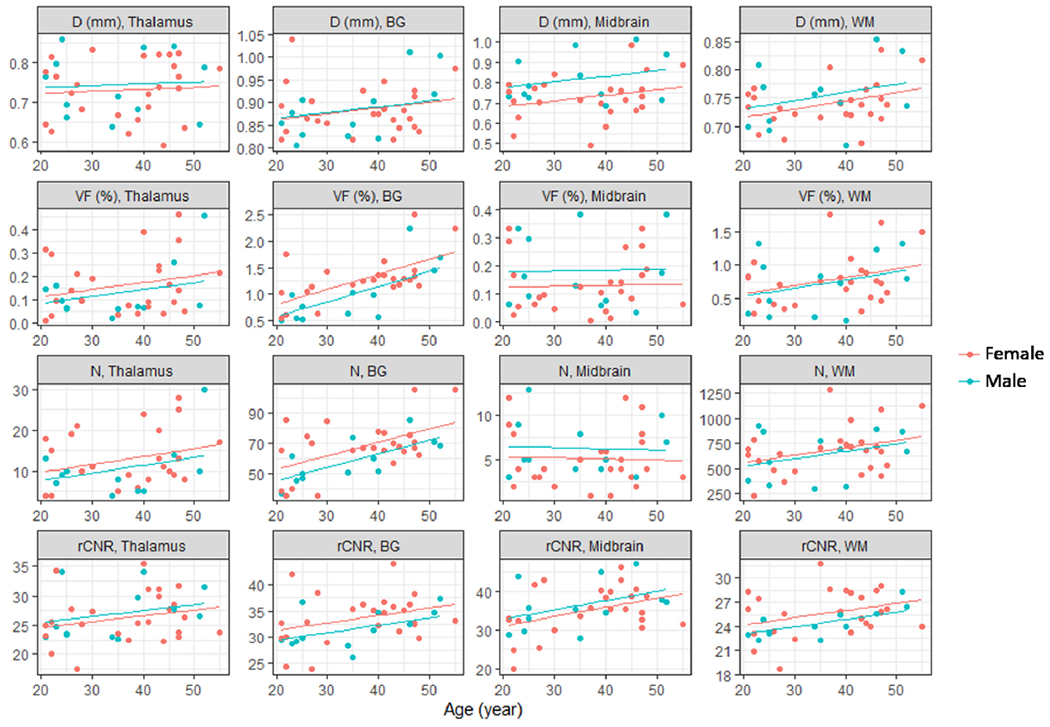
Scatter plots of the mean apparent diameter (first row), VF (second row), count (N) (third row), and rCNR (fourth row) of PVSVs versus age and gender in thalamus (first column), BG (second column), midbrain (third column), and WM (fourth column). The lines are best fits from linear regression analyses using age and gender as independent variables.