
Fig. 4.
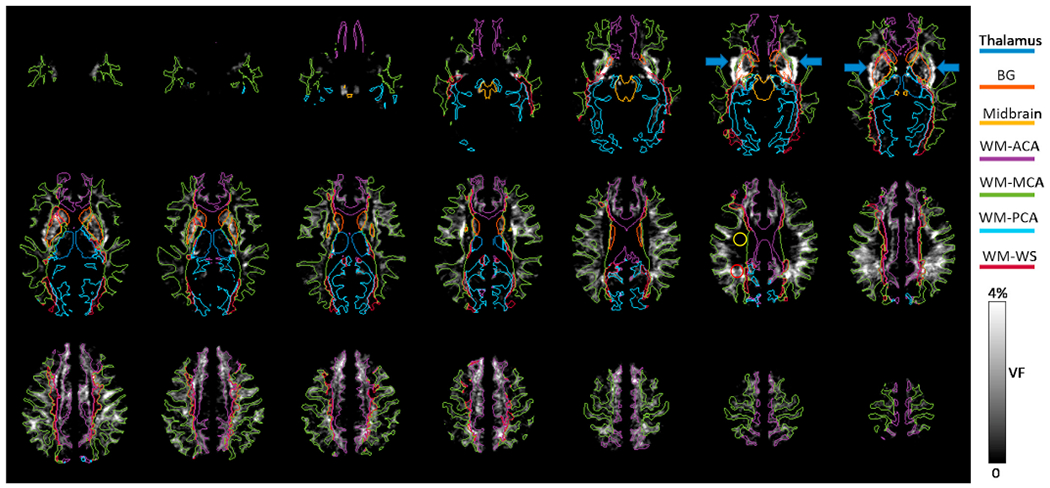
The group-averaged PVSV VF map in the MNI atlas space. The boundaries of 7 ROIs are also shown. The yellow and red circles are ROIs covering WM regions with low and high VFs, respectively. The blue arrows point to regions with high VF in the sub-insular WM.