Fig. 6.

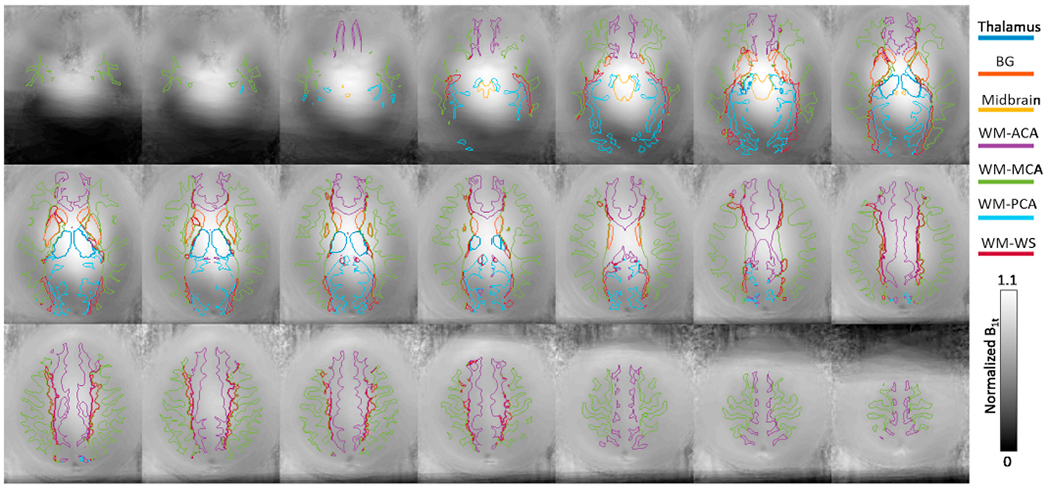
Group-averaged transmitter B1 map in the MNI atlas space. The boundaries of 7 ROIs defined in the study are also shown. The slice positions match those shown in Fig. 4.

Group-averaged transmitter B1 map in the MNI atlas space. The boundaries of 7 ROIs defined in the study are also shown. The slice positions match those shown in Fig. 4.