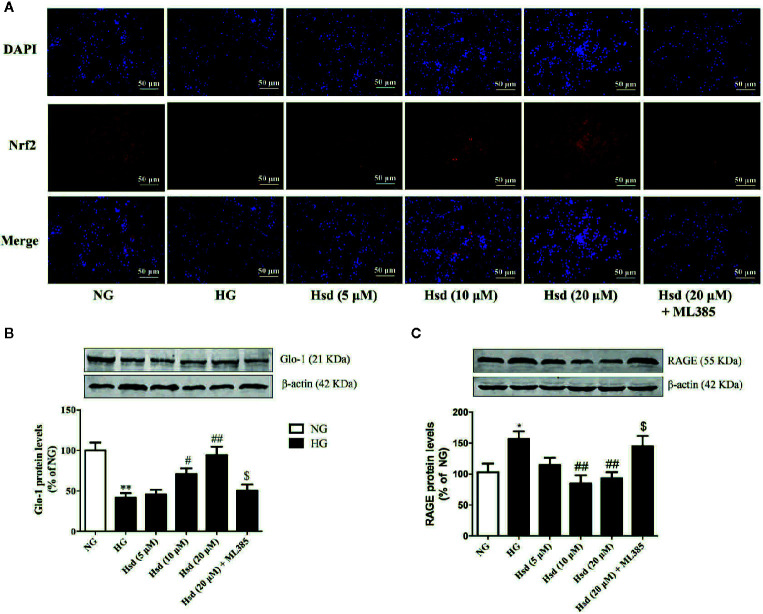
Figure 10.
(A) Effects of hesperidin on Nrf2 expression detected by immunofluorescence in N2a cells cultured with high glucose. (B) Effects of hesperidin on Glo-1 levels in N2a cells cultured with high glucose. (C) Effects of hesperidin on RAGE protein expression in N2a cells cultured with high glucose. The results represent the mean ± S.E.M., n = 3. * p < 0.05 and ** p < 0.01, vs. NG group. # p < 0.05 and ## p < 0.01, vs. DM group. $ p < 0.05 vs. Hsd (20 μM) group.

