Figure 4.

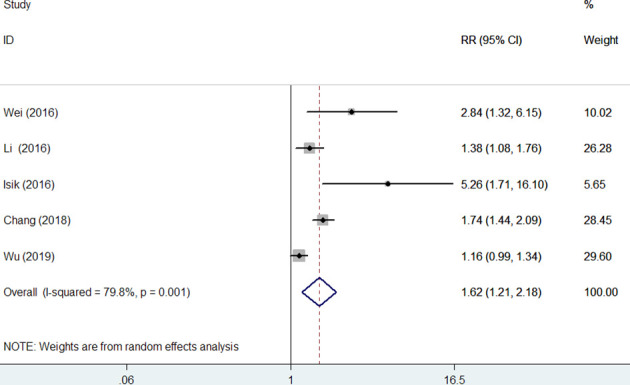
Forest plots showing pooled risk ratio with 95% CI of major adverse cardiac events for the higher versus lower red cell distribution width group in overall patients.

Forest plots showing pooled risk ratio with 95% CI of major adverse cardiac events for the higher versus lower red cell distribution width group in overall patients.