Figure 4.

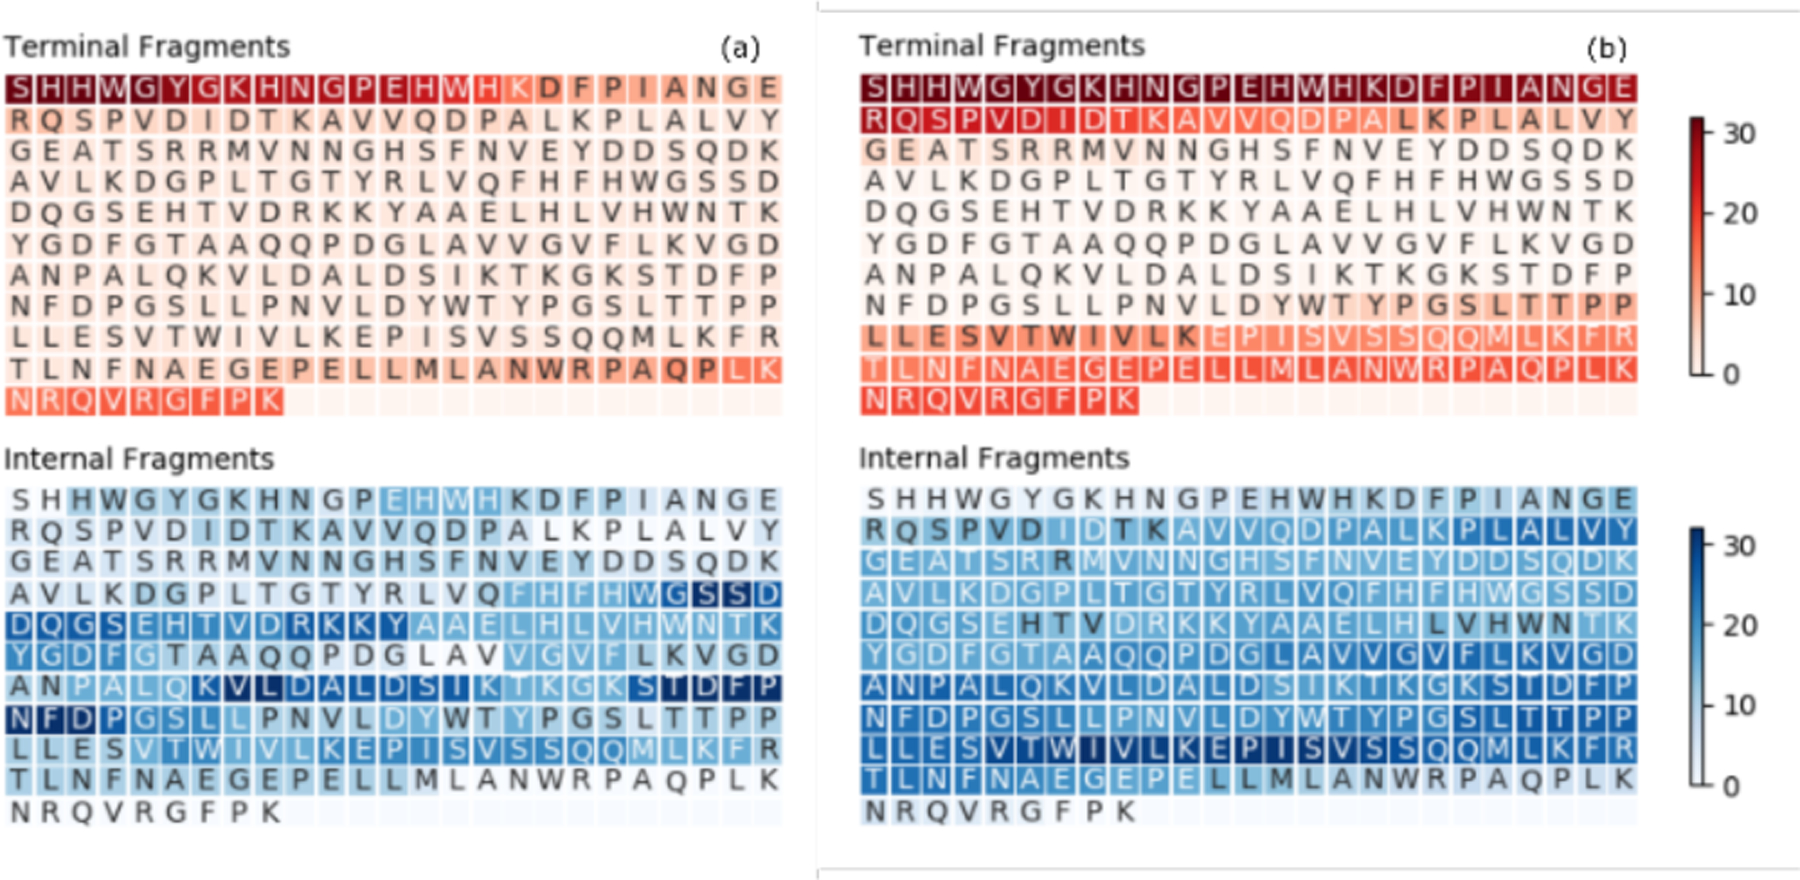
Heatmap depicting the number of times each residue is covered by a terminal fragment (top) or an internal fragment (bottom) for (a) ECD of [CAII, 25H]25+, and (b) EID of [CAII, 25H]25+. Darker colors indicate greater coverage.

Heatmap depicting the number of times each residue is covered by a terminal fragment (top) or an internal fragment (bottom) for (a) ECD of [CAII, 25H]25+, and (b) EID of [CAII, 25H]25+. Darker colors indicate greater coverage.