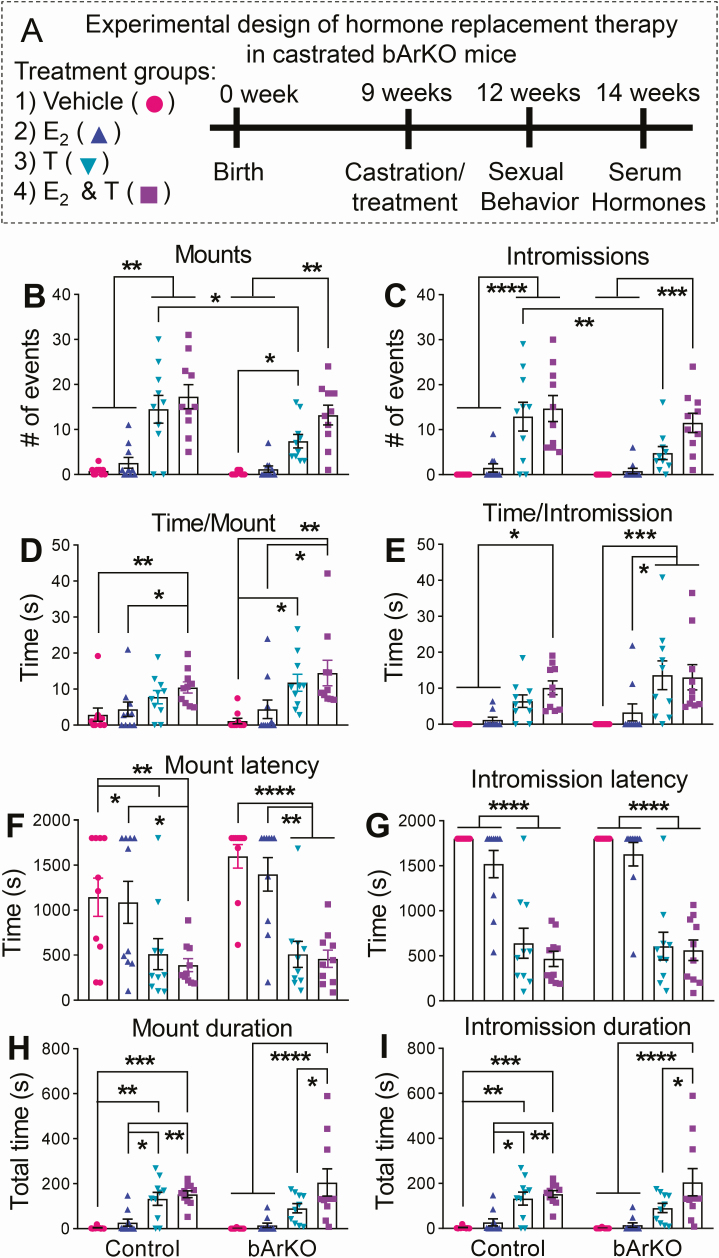
Figure 3.
Sexual behavior following hormone replacement in control and bArKO castrated mice. (A) Schematic diagram depicts the schedule of hormone replacement therapy and assays. (B) The number of mounts, (C) number of intromissions, (D) time per mount, (E) time per intromission, (F) first mount latency, (G) first intromission latency, (H) total time for mounts, and (I) total time for intromissions in castrated control and bArKO mice following each hormone treatment. n = 5 mice per group. Sexual activity was assessed in each mouse twice. Two-way ANOVA with Tukey multiple comparison test, *P < 0.05, **P < 0.01, ***P < 0.001, ****P < 0.0001.

