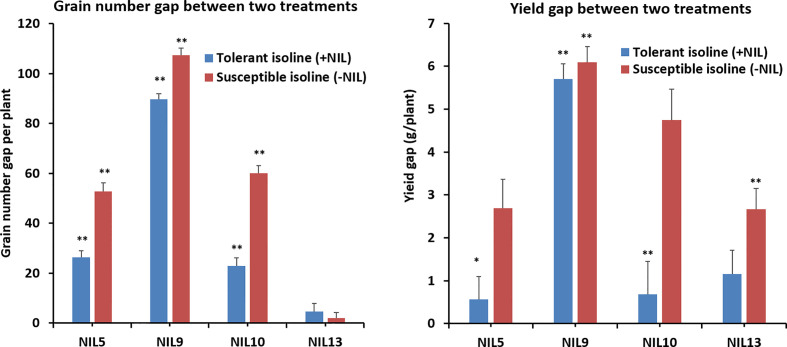
Figure 2.
Differences in agronomic trait gaps between the confirmed isolines of tolerant and susceptible alleles. Three replicates each for the control (naturally lit glasshouse with conditions described in detail in Table S1) and the heat-stressed treatment (growth chamber set at 37/27°C day/night) were used for statistical analysis. The column indicates trait gaps between the treatment and control, with error bar on top. * indicates significant difference at P ≤ 0.05; ** indicates significant difference at P ≤ 0.01. Statistics done using t-test.

