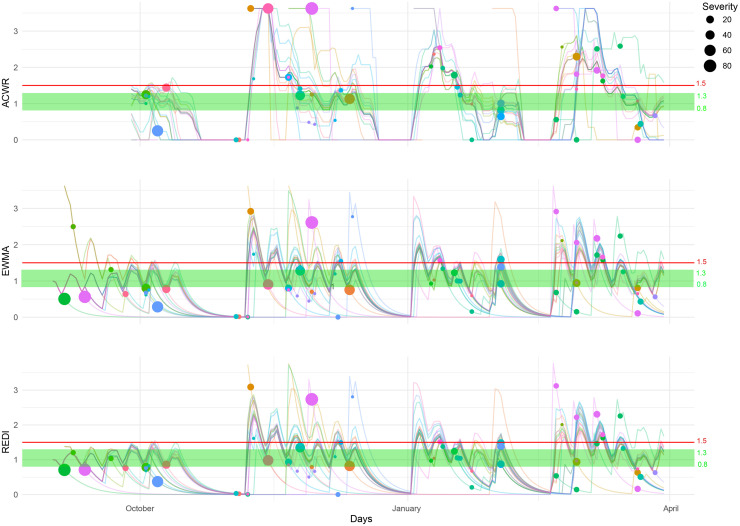
FIGURE 1.
Individual training load plotted with the ACWR, EWMA and REDI indices, and the occurrence and severity (days) of injuries for elite U16–U18 female soccer players. Each line represents an athlete’s training load over time calculated by ACWR (top chart), EWMA (middle chart) and REDI (bottom chart). Each dot represents an injury and the width of the dot depicts the severity. The green zone represents the so-called “sweet spot” for the three ratios, the potentially optimal workload ratio value between 0.8 and 1.3. Above the red line are the ratio values greater than 1.5.

