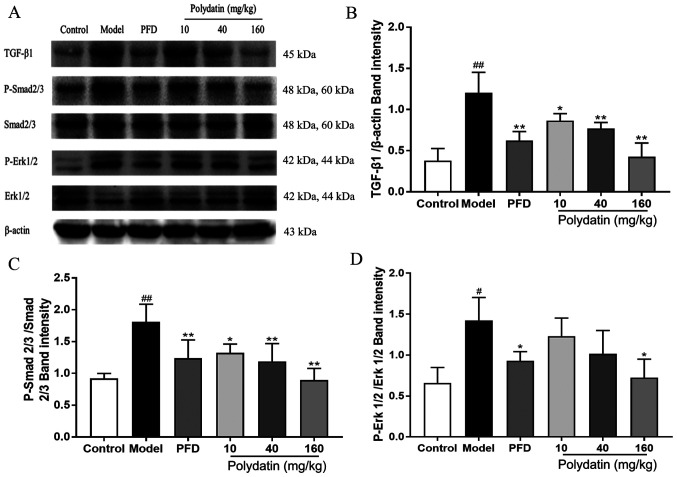
Figure 10.
Effects of PFD and polydatin on the TGF-β/Smad/ERK signaling pathway. (A) Representative western blots and quantitative analysis of (B) TGF-β1/β-actin, (C) p-Smad2/3/Smad2/3 and (D) p-ERK1/2/ERK1/2 levels in rats. Values are represented as mean ± standard deviation (n=3). ##P<0.01 and #P<0.05, the model group vs. the control group. **P<0.01 and *P<0.05, vs. the model group. PFD, pirfenidone; TGF-β, transforming growth factor-β; p-, phosphorylated.

