
Figure 2.
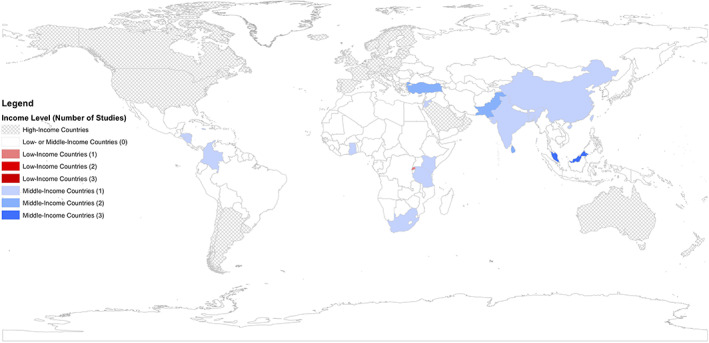
Geographic distribution of studies (n = 25) published by country income level. World map depicting countries of included studies based on income level and number of studies published.
Official websites use .gov
A
.gov website belongs to an official
government organization in the United States.
Secure .gov websites use HTTPS
A lock (
) or https:// means you've safely
connected to the .gov website. Share sensitive
information only on official, secure websites.
Geographic distribution of studies (n = 25) published by country income level. World map depicting countries of included studies based on income level and number of studies published.