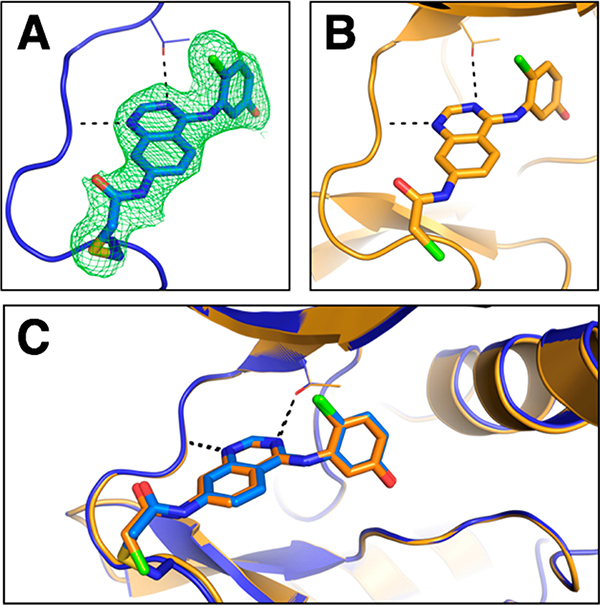
Figure 2.
Co-crystal structures verify the binding modes of the electrophilic quinazoline 1 to EphB1 variants. (A) Crystal structure of the EphB1G703C–1 complex. |2Fo–Fc| electron density map (contoured at 1 σ) shown as a green mesh supports the formation of a covalent bond between the inhibitor and the engineered cysteine (Cys703). (B) Crystal structure of the EphB1WT–1 complex. (C) Overlay of the two structures. The protein is shown as a cartoon representation (EphB1G703C in blue and EphB1WT in orange), while the ligand and C703 are shown as sticks.

