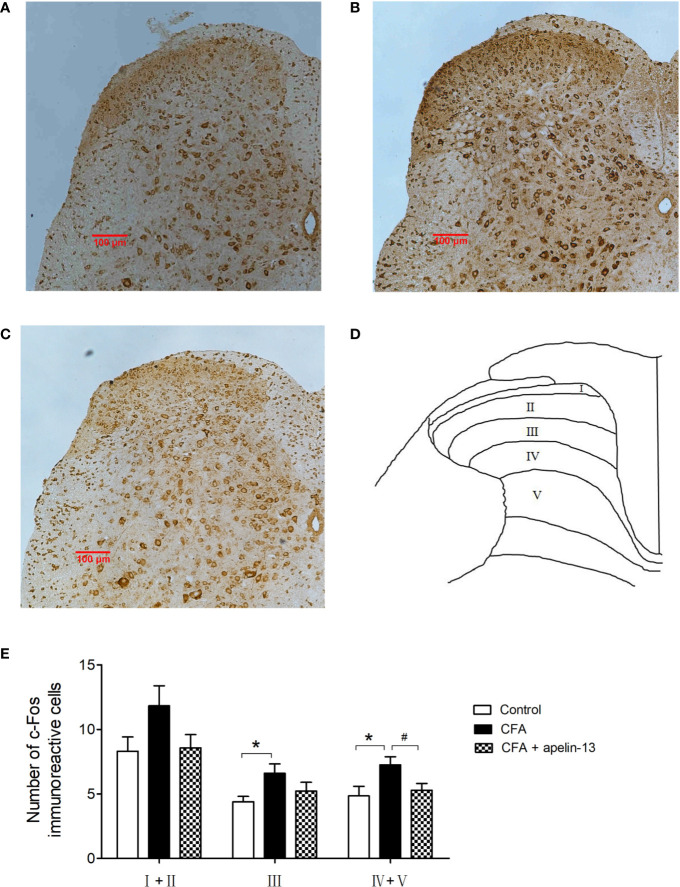
Figure 6.
Effect of apelin-13 on Fos protein expression in L4/5 spinal cord in mice. Representative sections of the lumbar spinal cord showing Fos-positive cells in the vehicle control (i.d. NS + i.t. NS, A), CFA group (i.d. CFA + i.t. NS, B) and apelin-13-treated group (i.d. CFA + i.t. NS, C). (D) Objective to measure and evaluate the distribution of Fos-positive cells of the lumbar spinal cord in mice. (E) Quantification of the number of Fos-positive cells in the spinal cord L4/5 segments from mice. Data are expressed as means ± SEM. *p < 0.05, compared with vehicle control (i.d. NS + i.t. NS); #p < 0.05, compared with CFA group (i.d. NS + i.t. CFA). n = 6 per group. Scale bars = 100 μm.

