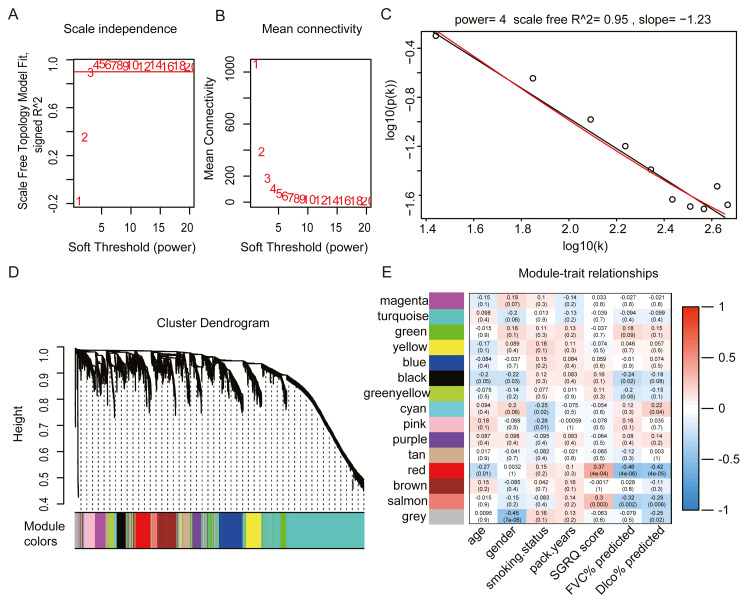
Figure 2. Construct gene co-expression network and identify key module in 93 IPF patients from GSE32537 dataset.
(A–C) The process of selecting soft threshold. When we set R2 > 0.9, β = 4 is chosen, log-log plot of network connectivity distribution is almost a straight line, which represents that the network is approximately scale-free topology. (D) Cluster dendrogram and module color. branch represents gene cluster by average linkage hierarchical clustering and each color under cluster represents one co-expression gene module by the Dynamic Tree Cut. (E) Heatmap of correlation between module eigengenes and clinical traits. red color indicates positive correlation and green indicates negative correlation. In each cell, the up number represents correlation coefficients and the bottom number represents P value. The red module has the strongest negative correlation with lung function.

