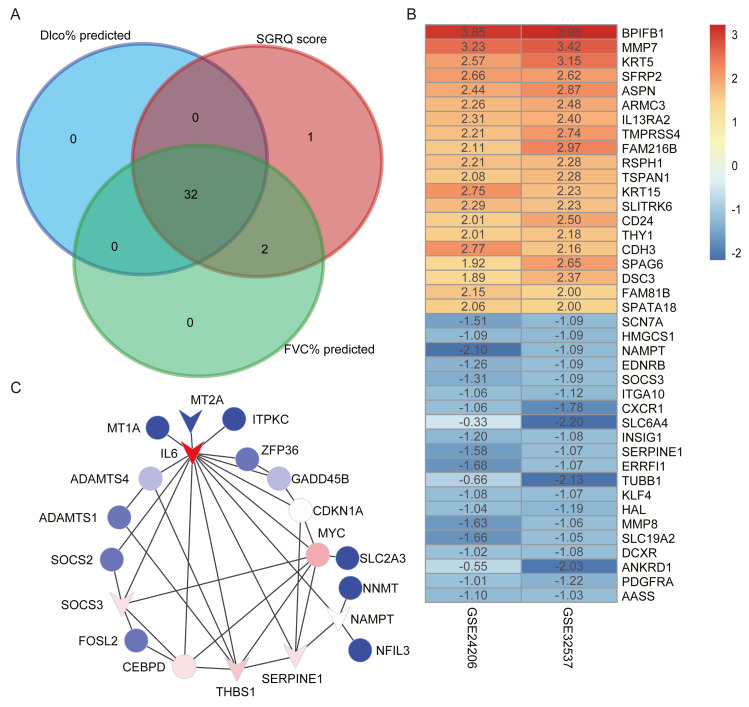
Figure 4. Construct PPI network and identify hub genes.
(A) The intersection of candidate hub genes for clinical traits: Dlco% predicted, FVC% predicted and SGRQ score. (B) The top 20 upregulated genes and top 20 downregulated genes in IPF compared with healthy donors. The numbers in each rectangle show the logarithmic fold-change of genes in each dataset. Red represents upregulated gene and blue represents downregulated genes. (C) The PPI network visualized by Cytoscape software. We removed the 11 nodes which had no connections with others. The network contains 20 nodes and 35 edges. The triangle represented downregulation in IPF. Degree of connectivity was showed by different colors; the darker shade of red represents the higher degree of connectivity and, conversely, the darker shade of blue color indicates the lower degree of connectivity.

