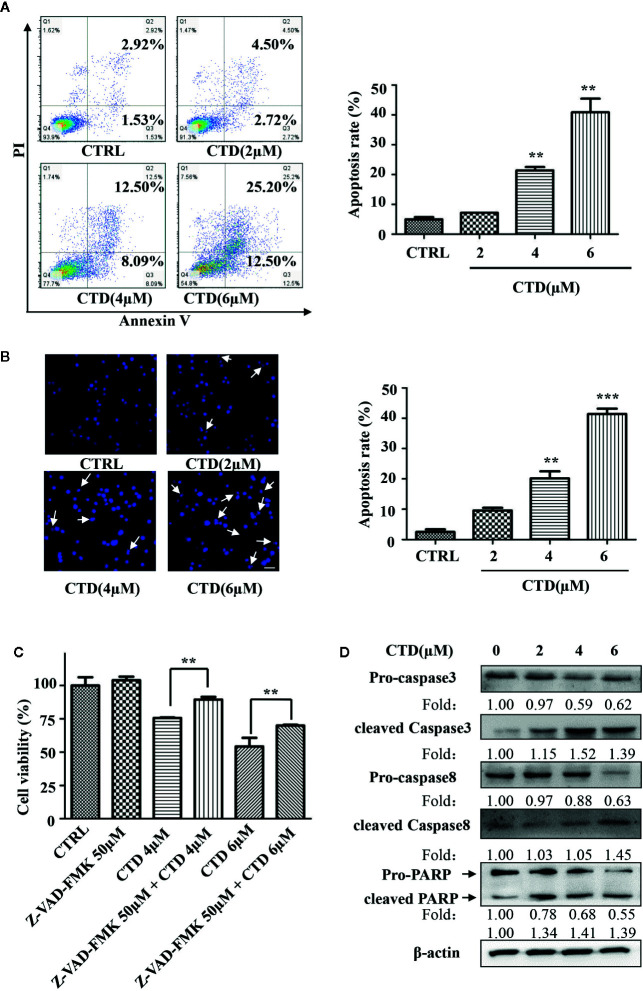
Figure 2.
CTD induced apoptosis of HL-60 cells. HL-60 cells were treated with CTD as indicated for 48 h. (A, B) Apoptotic cells were determined by flow cytometry and Hoechst 33342 staining (n = 3). (C) HL-60 cells were pre-treated with the pan-caspase inhibitor Z-VAD-FMK for 2 h and then treated with CTD as indicated for 48 h. Cell viability was measured using CCK-8 assay. (D) HL-60 cells were treated with CTD as indicated for 48 h and then apoptosis-related proteins were detected by Western blotting. The blots were a representative of three independent experiments. The scale bar is 100 μm. Values are presented as the means ± SD. **p < 0.01, ***p < 0.01 vs control.

