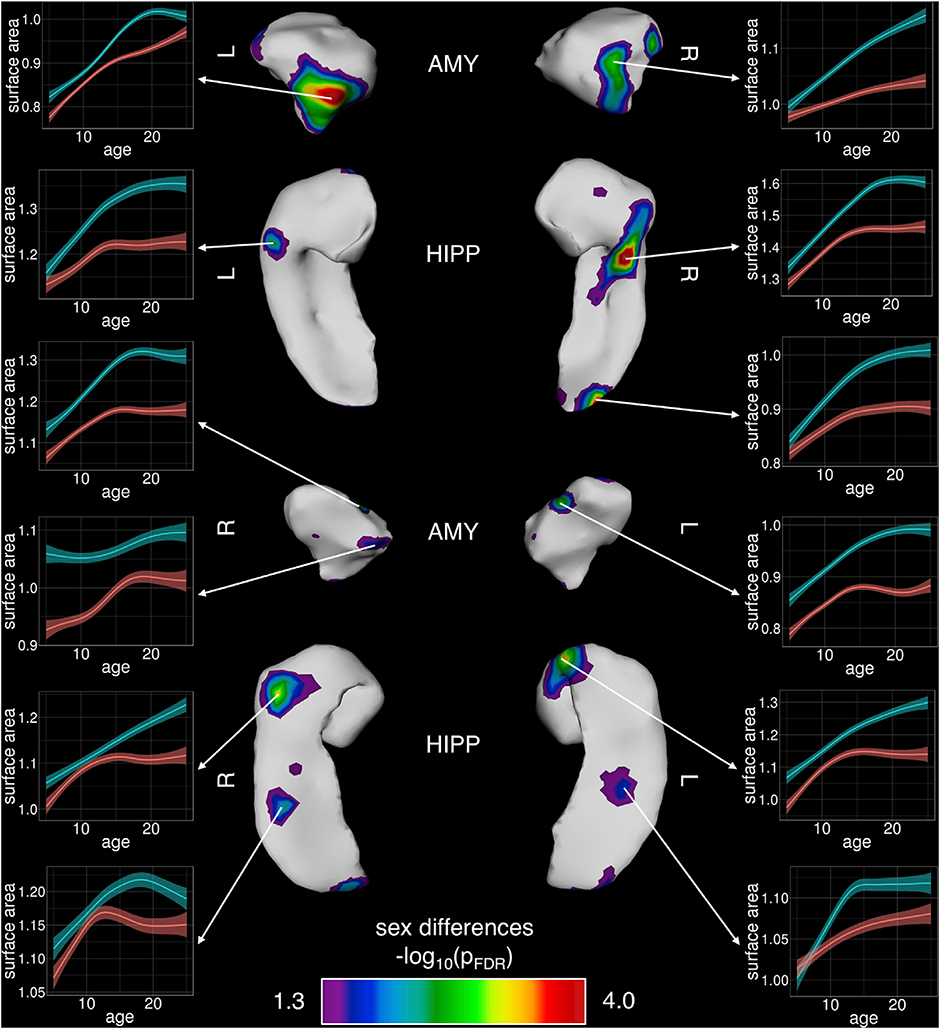
Fig. 2.
Foci of Statistically-Significant Sex-Differences in Development of Regional Amygdalar and Hippocampal Surface Area.
Bilaterally symmetric areas of regional sex differences are shown across the left and right amygdala and hippocampus, where statistically-significant foci are illustrated post FDR-correction. Inset plots of surface area by age at individual vertices are provided to further illustrate male/female trajectory differences (males = blue/ females=red).

