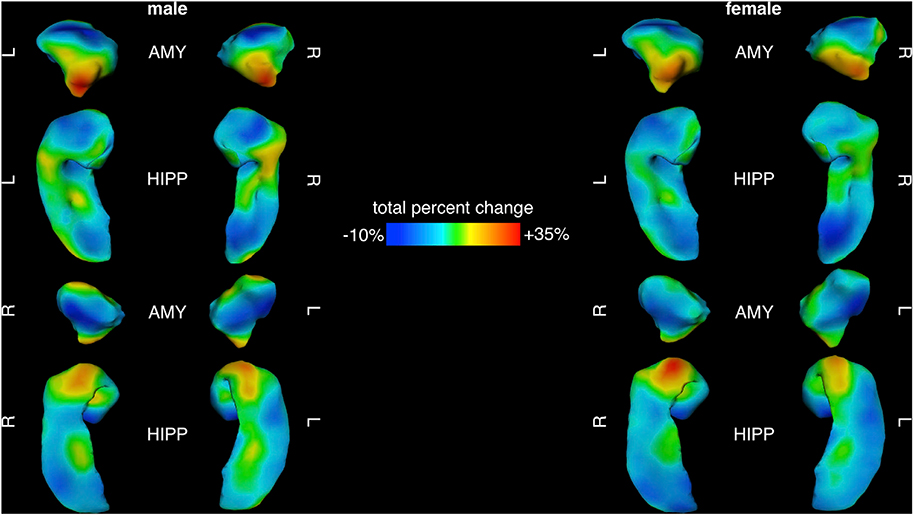
Fig. 3.
Percent Area Change Maps for Amygdala and Hippocampus Between 5 and 25 Years of Age in Males and Females.
Maps of total percent change across the male (left) and female (right) amygdala and hippocampus, with blue representing the most stable areas (least dynamic) and red indicating areas of greatest areal expansion (most dynamic) from 5 to 25 years of age.

