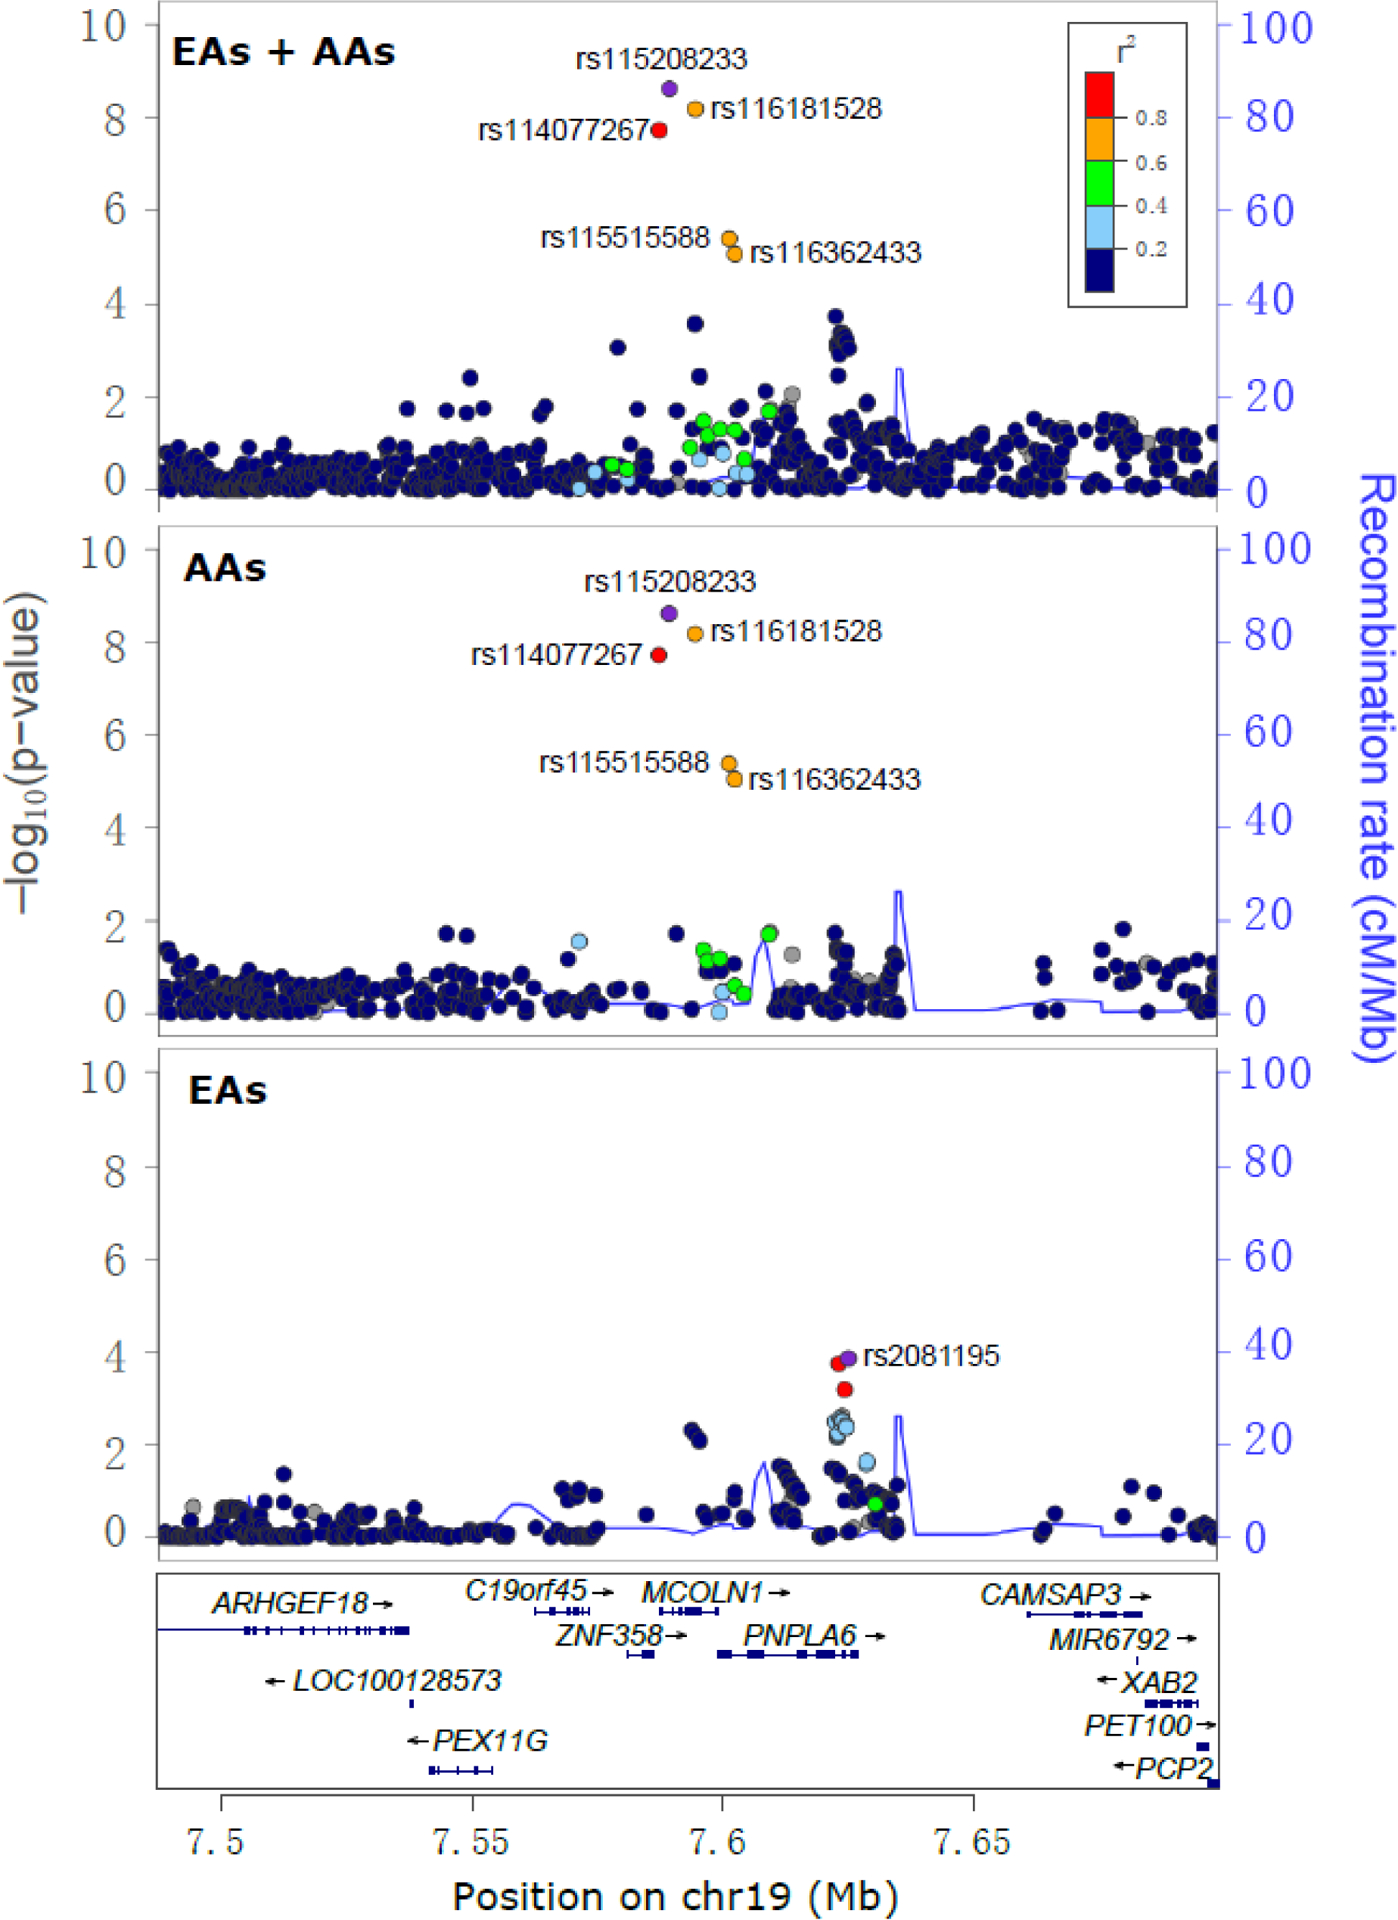
Figure 2.

Regional Manhattan plots displaying one independent signal associated with opioid overdose (OpOD) severity on the locus MCOLN1. Three panels illustrate the association signals that emerged from the meta-analysis of all European Americans (EAs) and African Americans (AAs) and in the meta-analysis of EAs and AAs separately. Three genome-wide significant SNPs specific to the AA population map to MCOLN1: rs115208233, rs116181528 and rs114077267. Among these, rs115208233 is the lead SNP and rs114077267 is in the promoter region of MCOLN1. Two other AA-specific SNPs, rs116362433 (an intronic SNP of MCOLN1) and rs115515588 (a promoter SNP of PNPLA6), were nominally associated with OpOD severity (all P values ~5×10⁻⁶). One SNP, rs2081195, located in the intronic region of PNPLA6, was nominally significantly associated with OpOD severity in EAs (P=1.4×10⁻⁴). Note: the SNPs are colored to reflect the linkage disequilibrium (R2) with the lead SNP (rs115208233 for EAs and EAs+AAs; rs2081195 for EAs) based on the African (for AAs and EAs+AAs) or European (for EAs) population data from the 1000 Genomes Project. The light blue line and right Y-axis indicate the observed recombination rate estimated from HapMap samples. Only association signals existing in ≥2 cohorts are plotted.
