Figure 5.

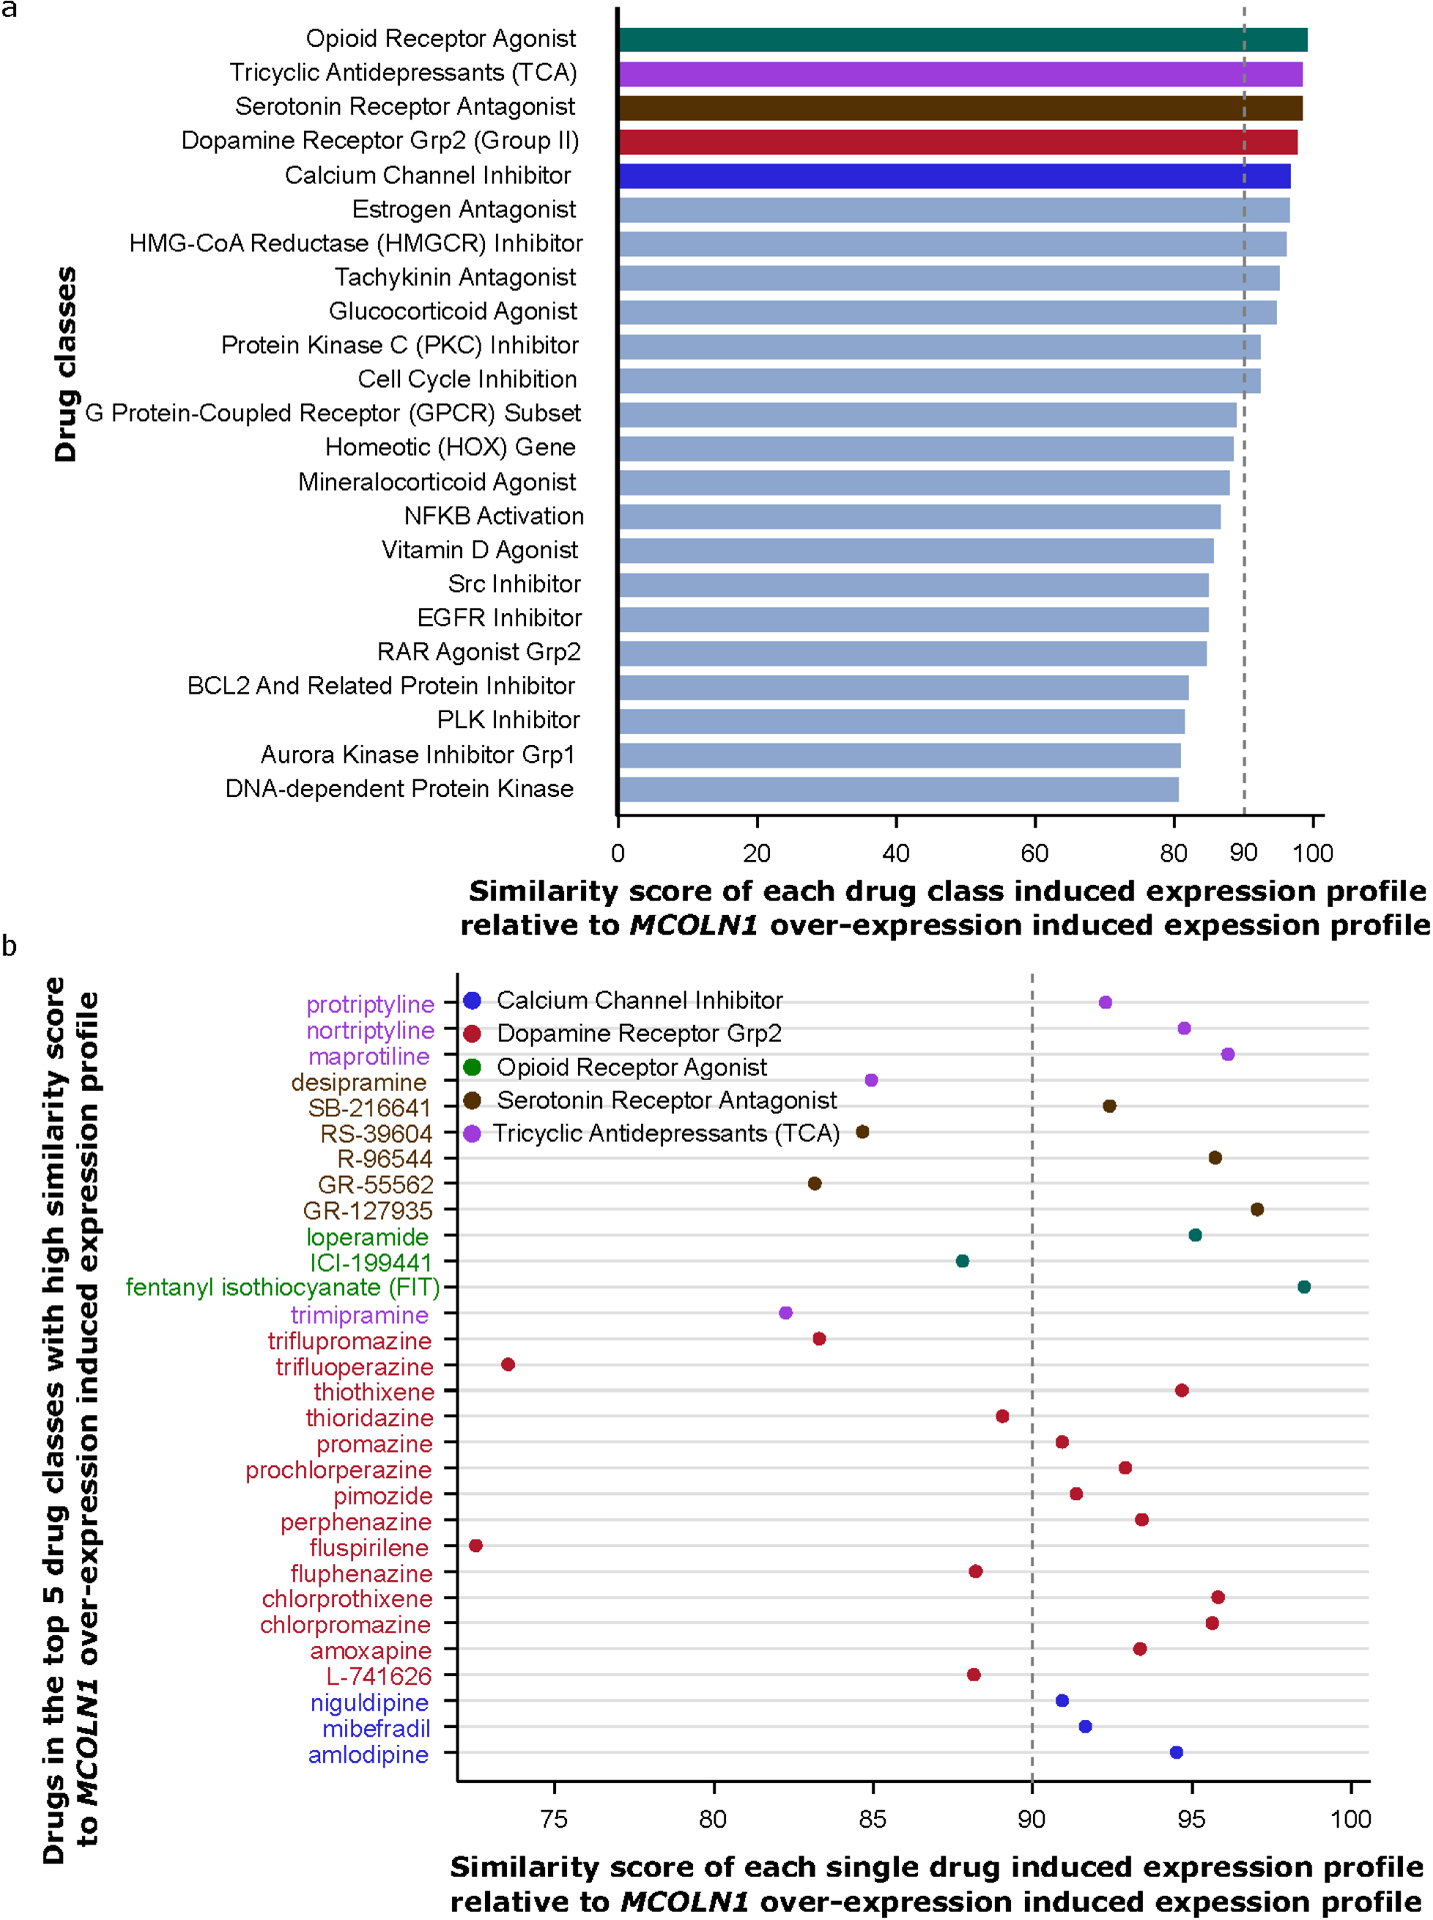
Drug repositioning analysis supports the involvement of MCOLN1 in the opioid receptor system. (a) Among 83 drug classes, opioid receptor agonist-induced expression profiles display the highest expression similarity score with the MCOLN1 over-expression induced profile in CMap. Expression similarity scores are generated by comparing the MCOLN1 over-expression induced expression profile to the signatures of 83 classes of drug-induced transcription. (b) Single drugs from these top 5 drug classes (highlighted in part a) with expression similarity score >=80 are shown.
