
Figure 3. CypA overexpression increases EC-derived αSMA positive cells in vivo, indicating EndMT.
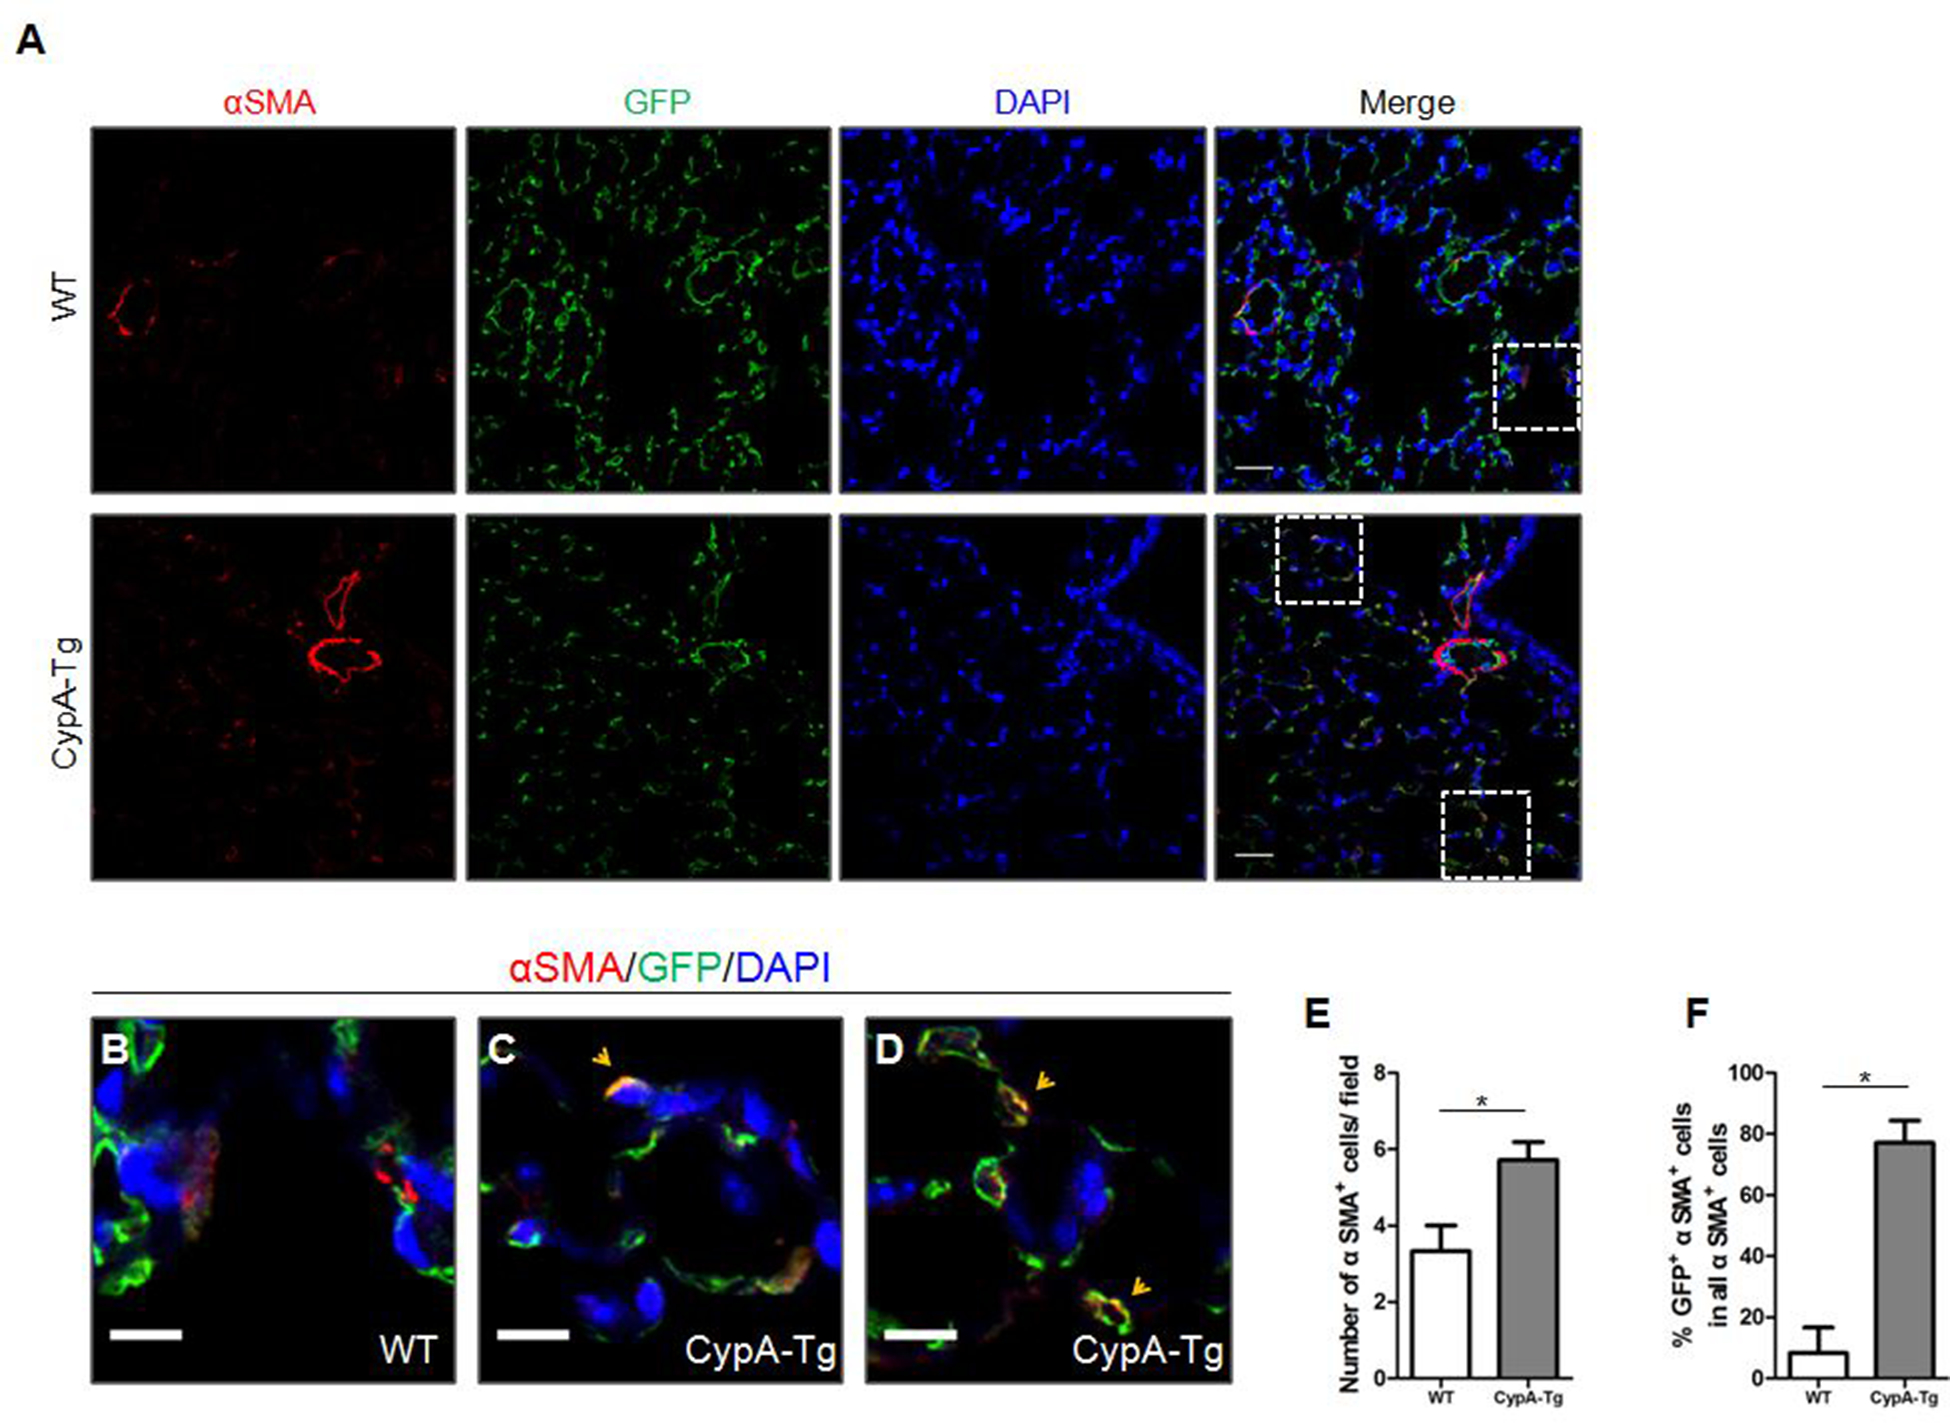
A, Representative immunofluoresence images for αSMA (red), GFP (green) and DAPI (blue) of pulmonary arteries and alveoli in lung sections from WT;mTmG (n=5) and Cdh5-CypA;mTmG mice (n=8). Scale bar, 25μm. B-D, Magnification of white boxes indicated in A. Scale bar, 10μm. E-F, Quantification of the total number of αSMA+ cells per field (E) and the percentage αSMA+ cells that were GFP+ in all αSMA+ cells (F) as shown in A. Data are mean±SEM. *P<0.05.