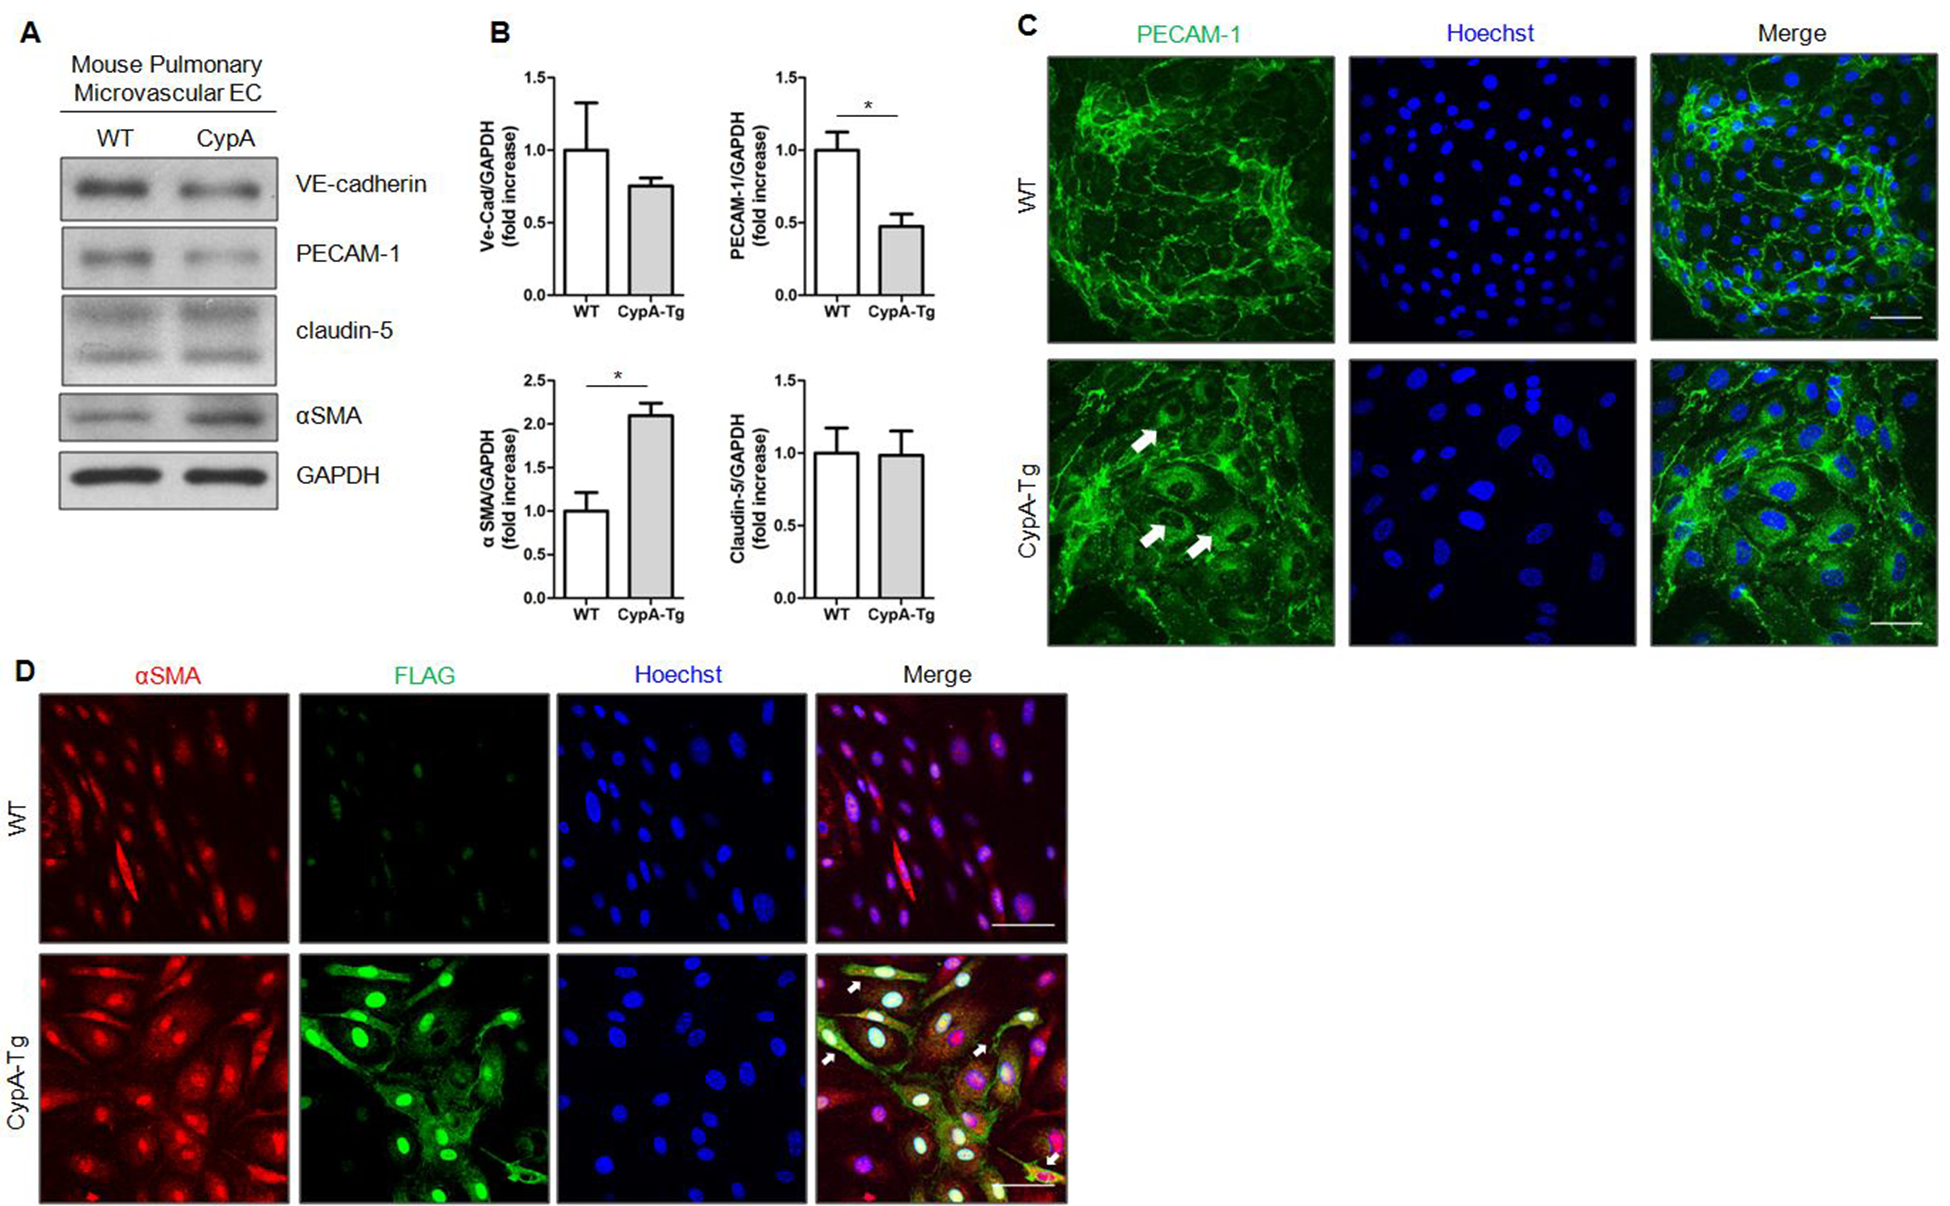
Figure 4. Pulmonary ECs from ecCypA-Tg mouse show an EndMT phenotype.

A, Expression of endothelial and mesenchymal markers in cultured MPMEC isolated from control and ecCypA-Tg mice. B, Quantification of protein expression shown in A. Data are mean±SEM. *P<0.05. C, Representative immunofluoresence images of cultured MPMEC isolated from control and ecCypA-Tg mice staining for PECAM-1(green) and Hoechst (blue). D, Representative immunofluoresence images of cultured MPMEC isolated from control and ecCypA-Tg mice staining for αSMA (red), FLAG (green) and Hoechst (blue). Scale bar, 50μm for all images.
