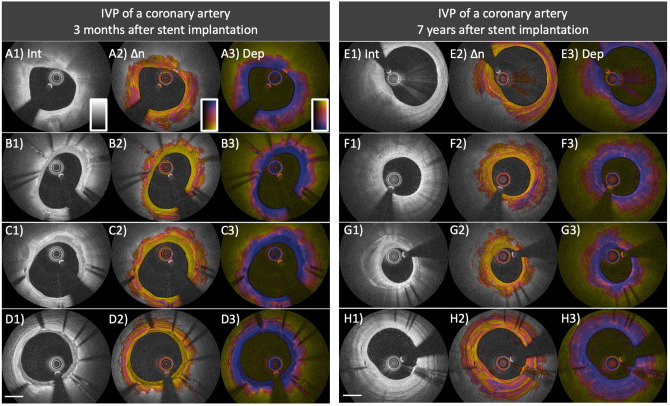
Figure 7.
Distinct polarization features of neointima and neoatherosclerosis. (A–D) IVP of a coronary artery 3 months after everolimus-eluting stent implantation. (A1) Native fibro-calcified plaque proximal of the stented segment. (B1–D1) The intensity images within the stented area show early neointima with high (B1) to low (D1) intensity signal. (B2–D2) Birefringence images reveal that early neointima exhibits low birefringence compared to that of the underlying native lesion. (B3–D3) Depolarization in early neointimal tissues remains low. (E–H) IVP of a coronary artery 7 years after paclitaxel-eluting stent implantation. (F1) Native fibro-calcified plaque proximal of the stented segment. (F1,G1) The intensity images show neoatherosclerosis featuring calcification, macrophage accumulation, and layered structure. (F2,G2) Birefringence images reveal lowly birefringent layered structures close to the surface of the arterial lumen. The layered structure in (G2) exhibits lower birefringence compared to the underlying neoatherosclerotic region. (F3,G3) Macrophage accumulations within neoatherosclerosis cause pronounced depolarization. (H2) The birefringence image of the late neointima without neoatherosclerosis reveals relatively high birefringence, comparable to that of underlying native plaque and the native plaque proximal of the stented segment (E2).

