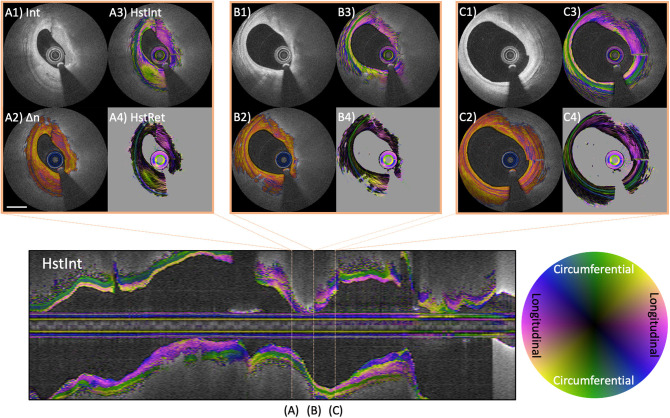
Figure 8.
Optic axis orientation in coronary atherosclerotic lesion. Longitudinal image displays the optic axis orientation overlaid on intensity of a coronary artery in a patient with stable angina pectoris. Color indicates axis orientation and brightness specifies intensity. (A–C) Three individual cross-sections, showing conventional intensity (A1,B1,C1), birefringence (A2,B2,C2), and depth-resolved optic axis overlaid on intensity (A3,B3,C3) or birefringence (A4,B4,C4). The tunica media features green color, indicating circumferential orientation. (A3,A4) Heterogeneous optic axis orientation of the intimal fibrous tissue. The fibrous cap in (B3,B4) and fibrous areas in (C3,C4) feature longitudinal orientation of the optic axis. Scale bar indicates 1 mm.

