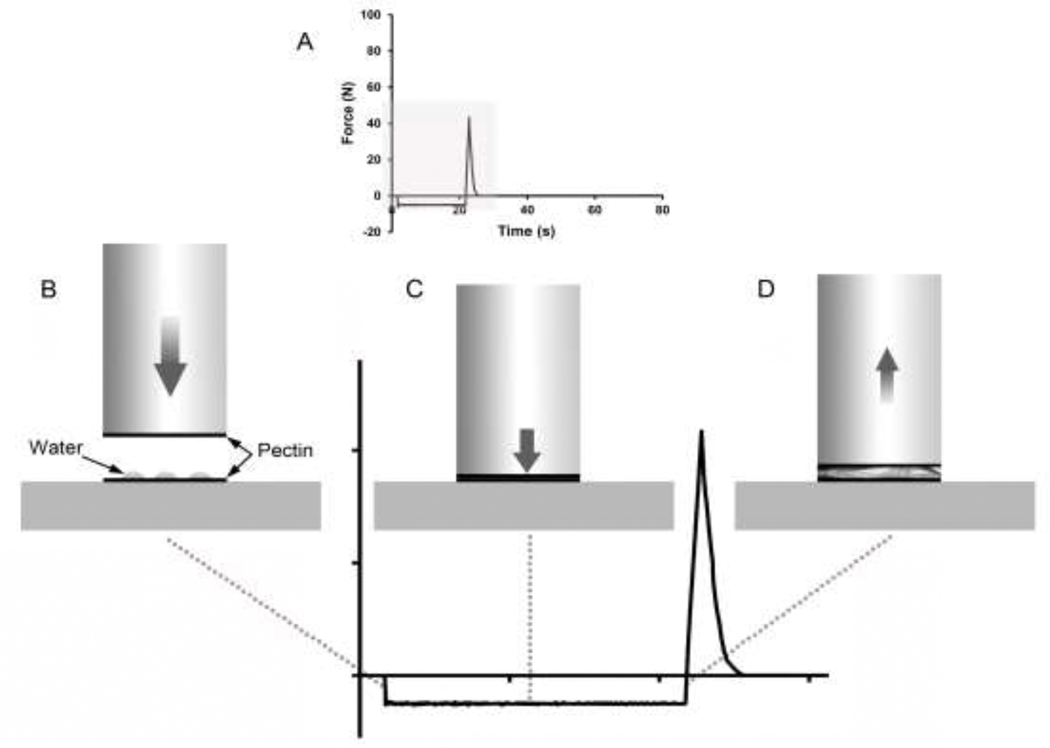
Figure 1.
Schematic of the adhesion test. A) The tracing reflects the probe forces during the adhesion and deadhesion events (recorded at 500 pps). Detail of the gray region is shown in B-D. B) In the initial phase, the probe descends at a pre-set velocity. The probe stops 1.5 mm above the film plane. C) In the second phase, the probe maintains a selectable compression force for a preset length of time. This time interval is referred to as the development time; it is the time allotted for the process of entanglement. D) The final phase of the assay is the withdrawal of the probe at 0.2 mm/sec. Probe withdrawal determines the peak force and debonding curve of the film interaction.

