Figure 3.
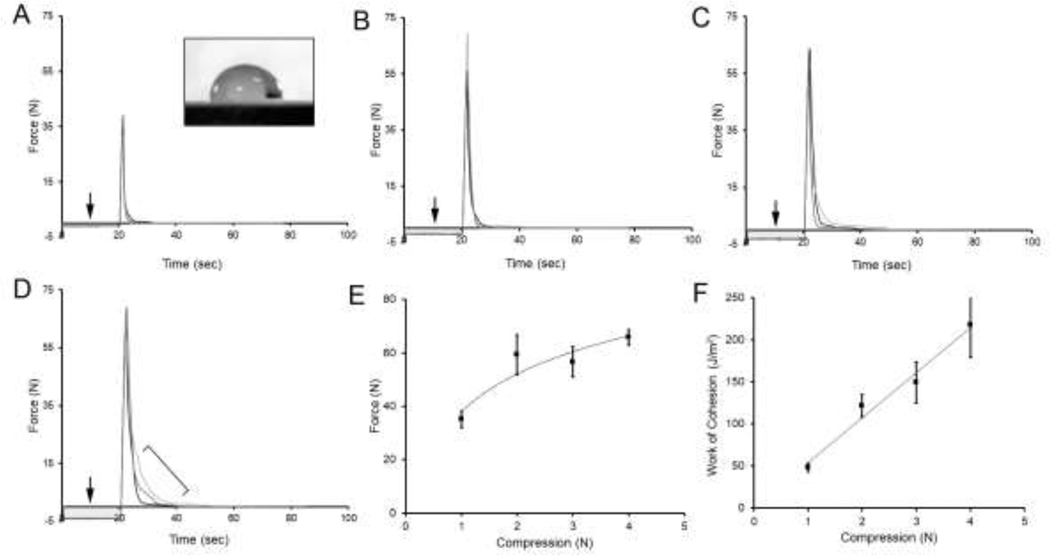
Surface energy of the glass phase films at the adhesive interface. Tensile strength adhesion curve between two glass phase pectin films (10% water content). Water droplets (10 μl) were gently placed between the glass films and compressed at variable forces (A-D, arrows). A) Without compression, the water droplets demonstrated a contact angle of 90° (inset) for more than 20 seconds indicating their availability for compression. A compression force of 1 N produced some increase in adhesion strength, but no debonding curve. B-D) Compression force of 2 N, 3 N and 4 N consistently demonstrated increased adhesion strength and evidence of debonding curves (D, bracket). E) The relationship of adhesion strength and compression force was described by a logarithmic trendline (R2= 0.9894). F) The area under the curves, reflecting the work of cohesion, increased with increasing compression velocity (linear trendline, R2 = 0.9745). Three representative curves are shown in each condition; error bars=1 SD; grayscale levels of individual curves are arbitrarily varied for presentation purposes.

