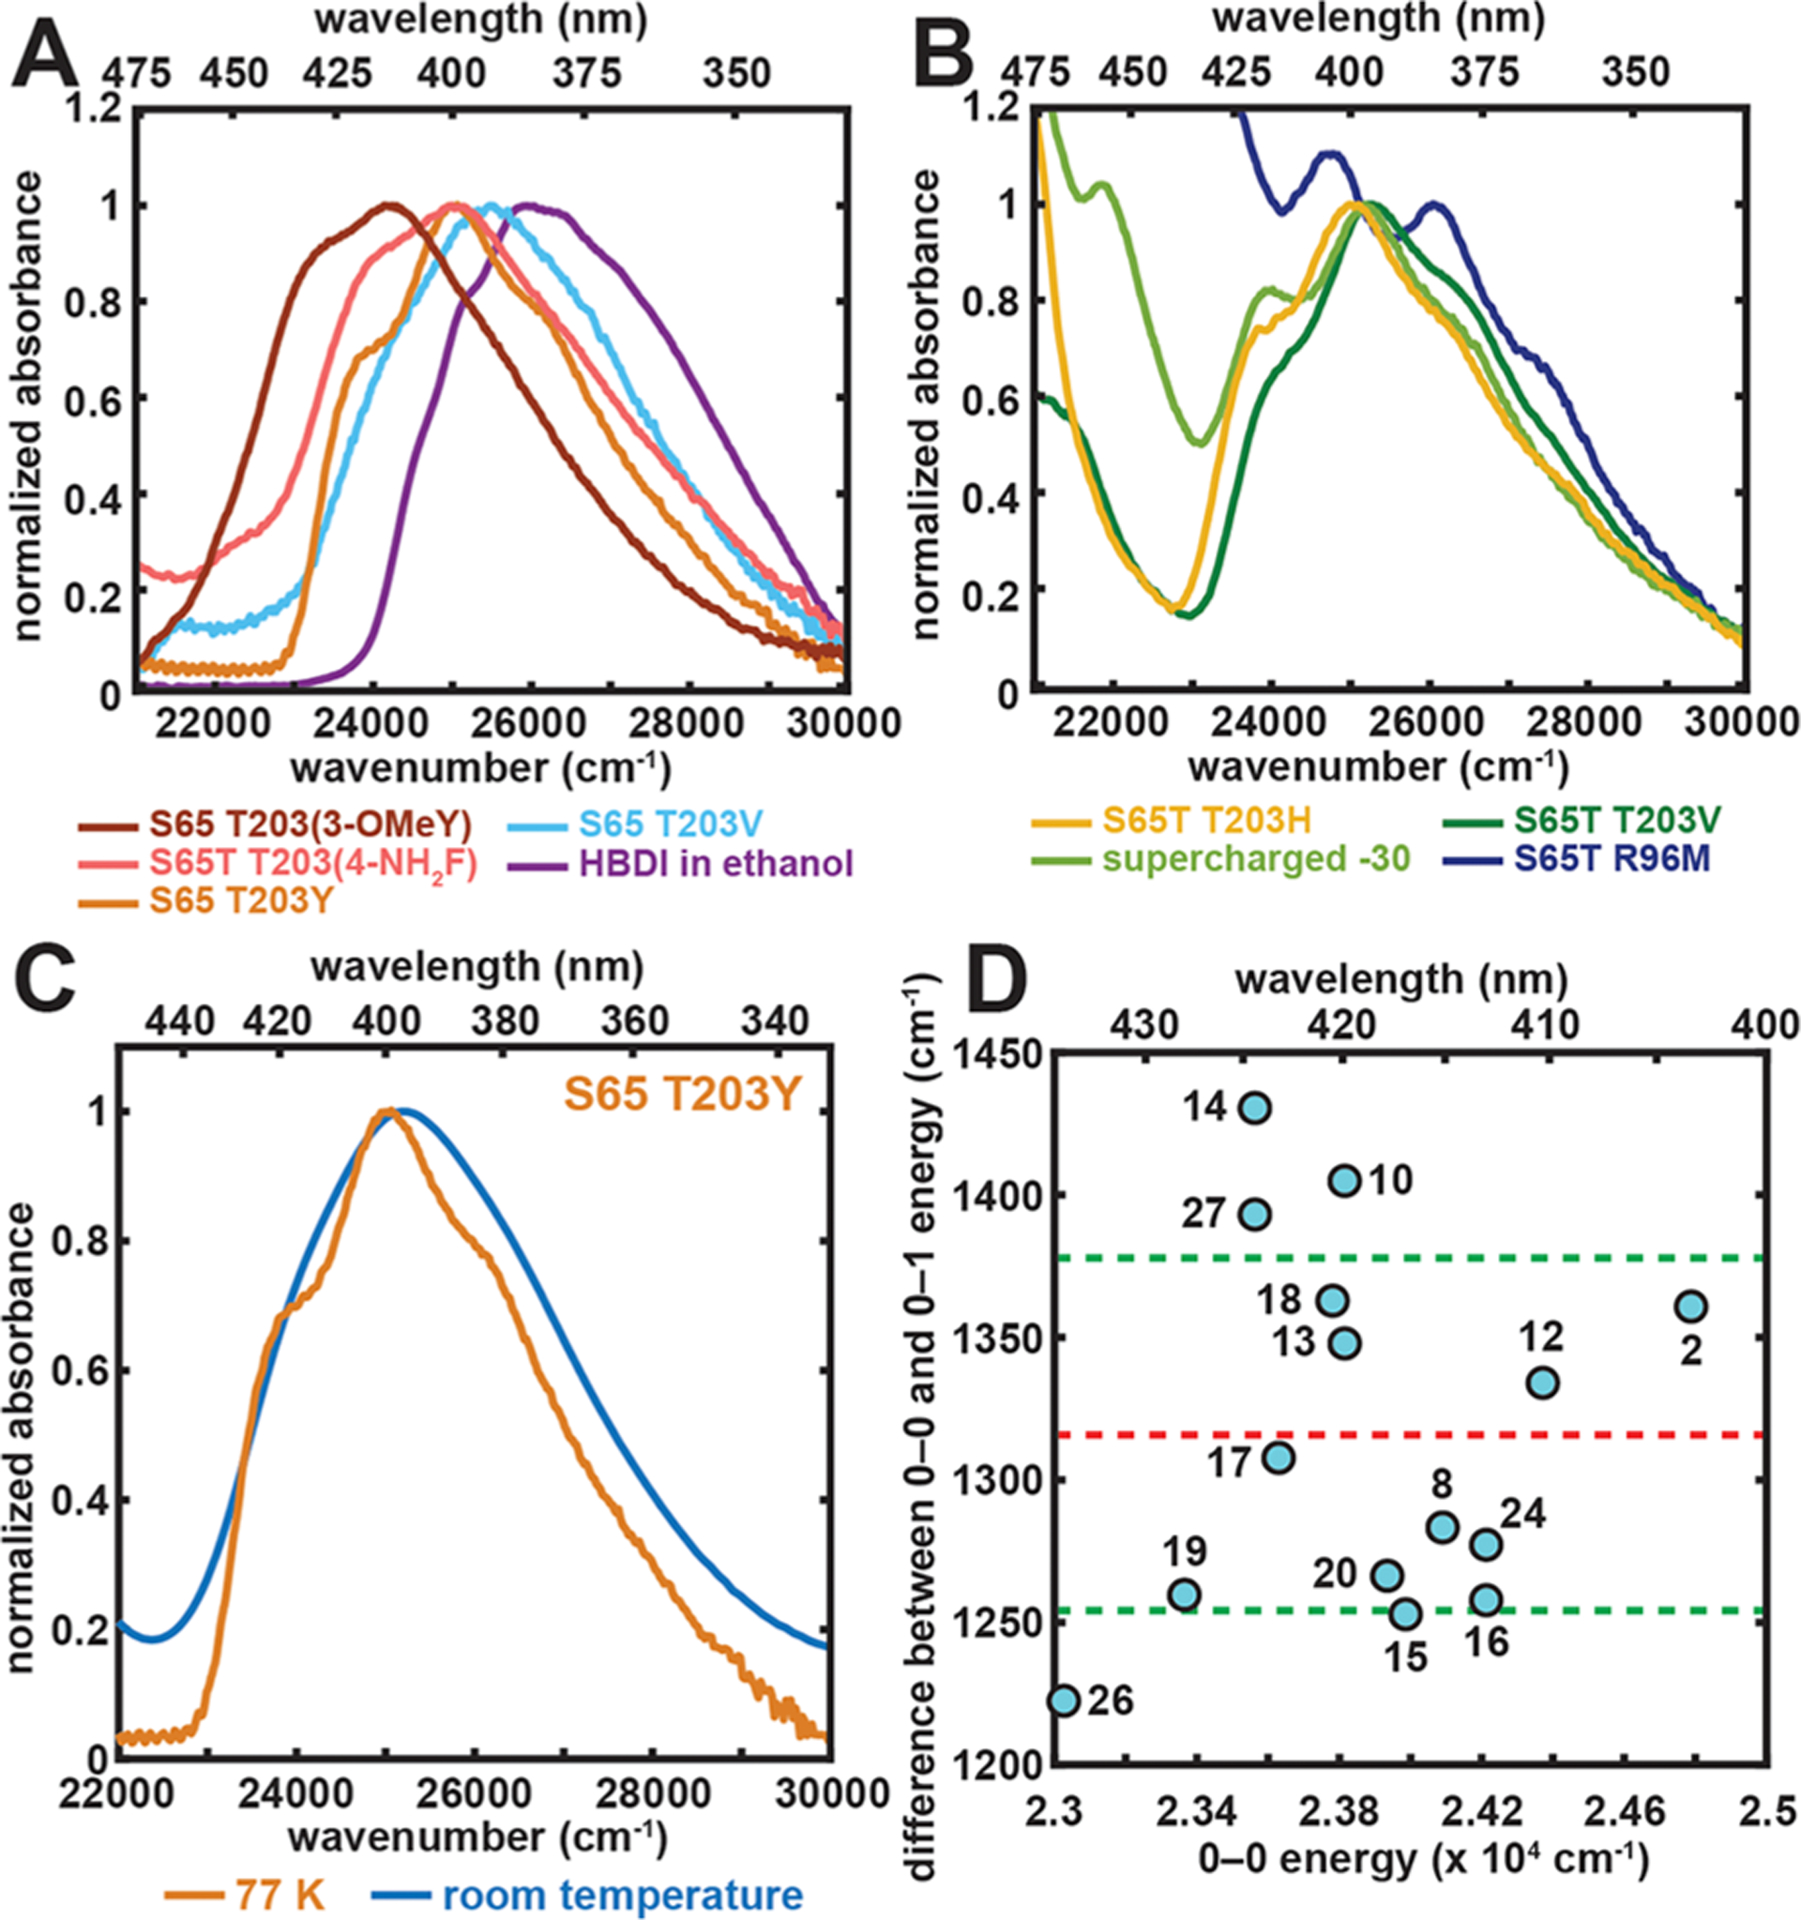
Figure 3.

Spectral properties and color tuning of the A state. (A and B) Representative 77 K absorption spectra of GFP mutants and the model chromophore HBDI in ethanol. The spectra are all normalized at their A-state peak maxima. The absorption maximum, later used in Figure 4, corresponds to the wavenumber at which the largest absorbance is observed for each mutant and the model chromophore, except for the R96M mutant, for which spectral deconvolution is done through Stark spectroscopy to extract the A-state absorption maximum (Figure S1). For GFP mutants, the samples of S65 T203(3-OMeY) and S65T T203(4-NH2F) were at pH 5.0 and 8.0, respectively. The rest were prepared at pH 10.0. Panel B includes constructs that contain the longer wavelength B band, corresponding to the anionic chromophore, in the spectral region of interest.13 (C) Representative room-temperature and 77 K absorption spectra for the A state of S65 T203Y. (D) Difference between the 0–0 and 0–1 energy plotted against 0–0 electronic excitation energy for GFP mutants obtained from a second derivative analysis (Figure S2). The x–y coordinates and the numerical labels for the species are listed in Table S2. The values are within a quite narrow range with an average of 1320 ± 60 cm−1. The red and green dashed lines represent the mean value and ±1 σ, respectively.
