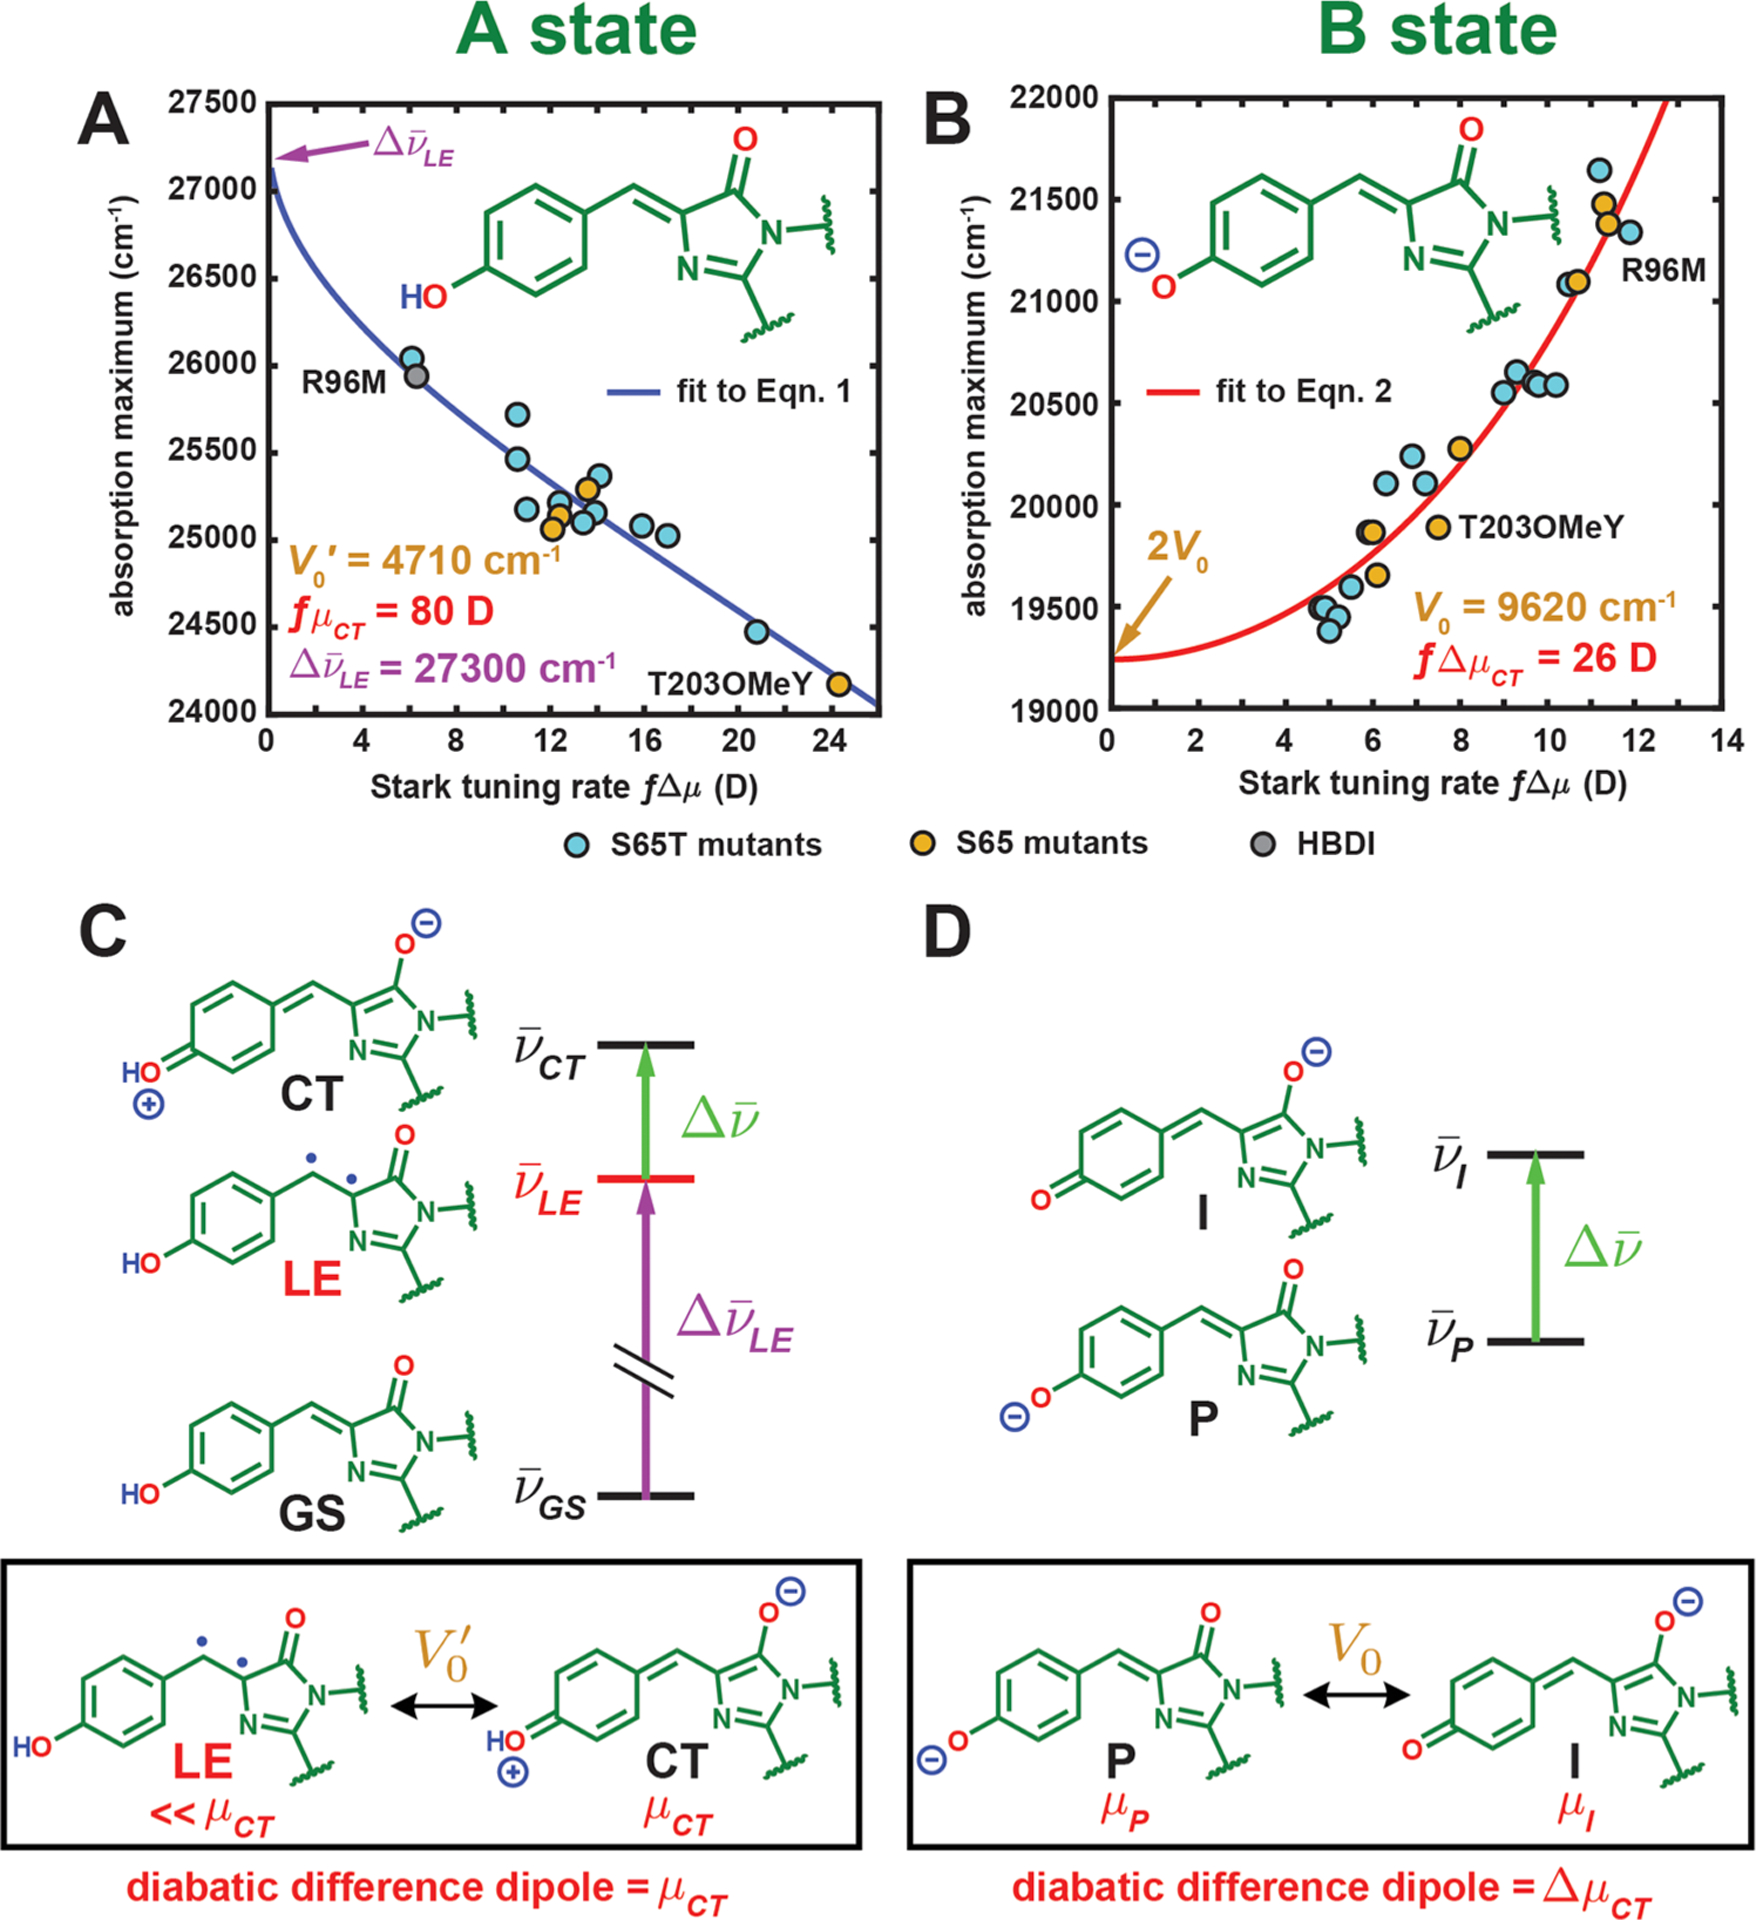
Figure 4.

Correlation between the absorption maximum and Stark tuning rate for GFP mutants and HBDI in the (A) A and (B) B states at 77 K, respectively. Panel B is reproduced from Figure 9 in ref 13 including only the S65T and S65 mutants’ data. The curves for panels A and B come from fitting all data (S65T for the latter) to eqs 1 and 2, respectively. See Figure S3 for an identical figure reproduced with numerical labels to identify the species. (C) The three-form model for the A state and (D) the two-form model for the B state. The two diabatic forms with substantial mixing are shown in the black box below each model with the corresponding electronic coupling and diabatic difference dipole. For both models, only is assumed to be tunable by the environment among all parameters. Note that the LE form has a nontrivial dipole moment, but it is much smaller than μCT (5 D29 vs 40 D for the CT form if f = 2), so we can approximately assign μCT to the dipole moment of the CT form. The diradicaloid structure illustrated for the LE form should not be treated as exact, but rather it is meant to represent the locally excited and nonzwitterionic nature of this third form (see section 2.3 for further discussion).
