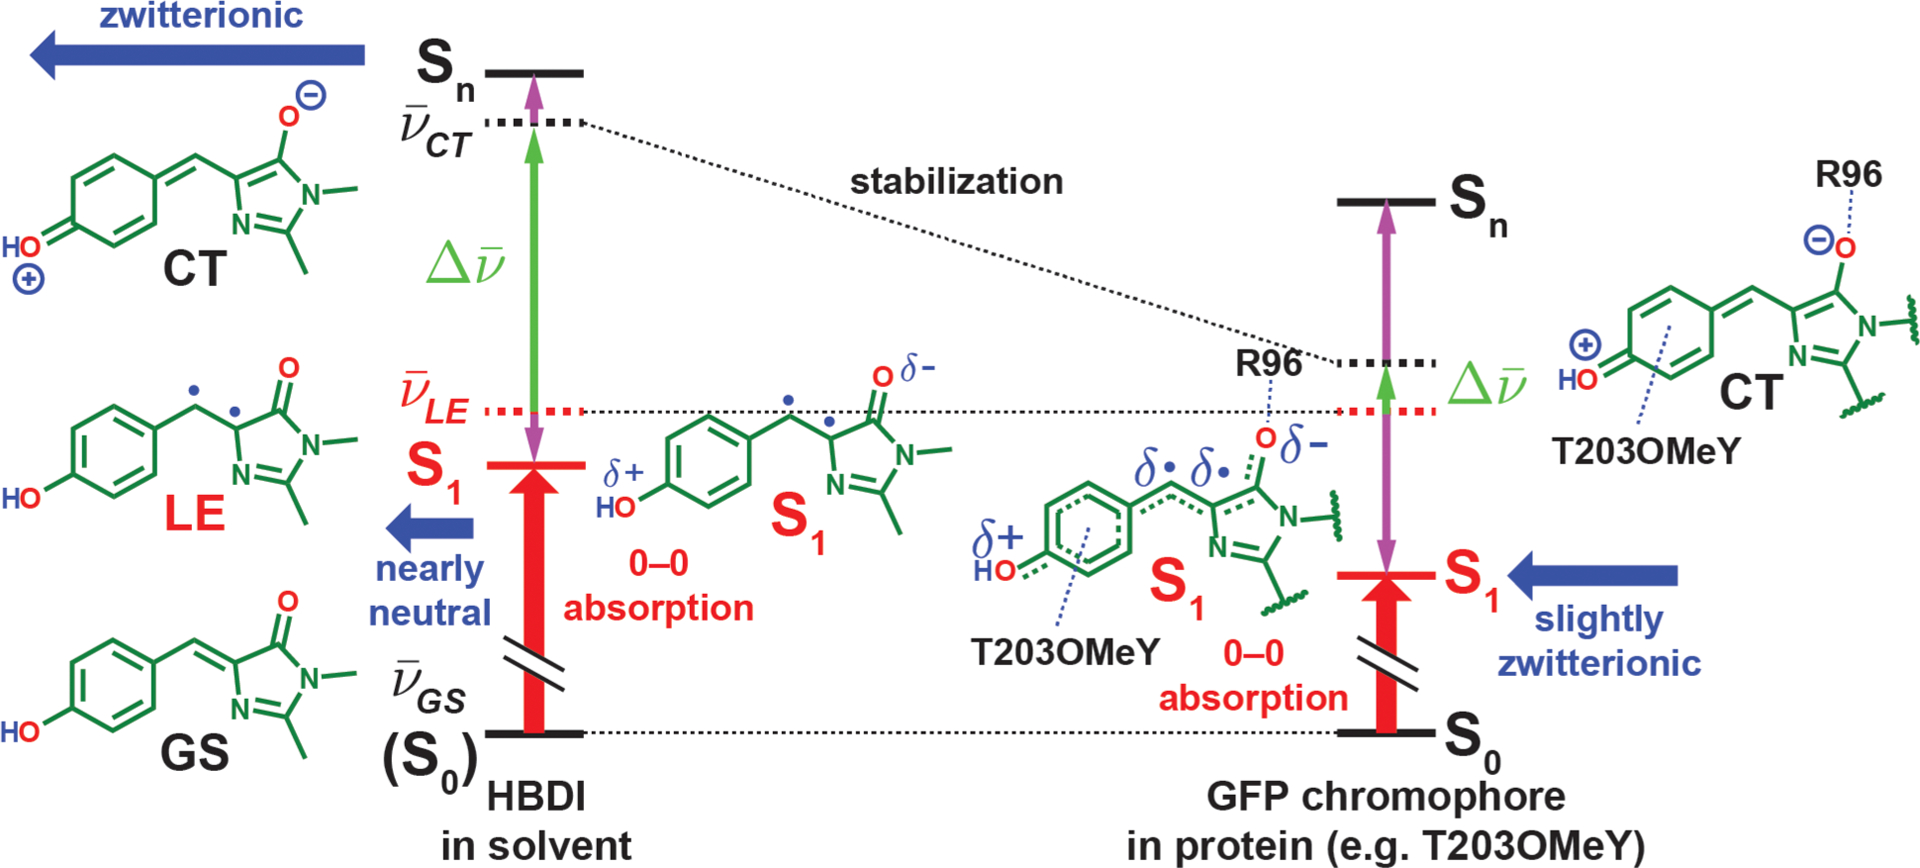
Figure 5.

Electrostatic color tuning mechanism of the protonated GFP chromophore, HBDI in solvent, and the covalently linked chromophore in proteins, illustrated qualitatively in different environments (energies not drawn to scale). The energy levels of the diabatic forms and adiabatic states (electronic eigenstates) are represented with dashed and solid lines, respectively. Because the GS form stays intact upon mixing and becomes the S0 state (denoted with parentheses on the left), we represent its energy levels with solid lines. The energy changes before and after mixing are shown with vertical purple arrows. The dipole moments of the CT form and the resulting S1 states are depicted with horizontal blue thick arrows, while the 0–0 electronic excitation energy is shown as a vertical red thick arrow in each scenario. The protein environment is more capable of stabilizing the zwitterionic CT form with R96 and the residue at position T203 than solvents, thereby bringing the CT form closer in energy to the LE form and leading to stronger mixing, which subsequently lowers the S1 energy and imparts stronger charger-transfer character to the S1 state and thus a larger Stark tuning rate. The resulting CT character of the S1 state ranges from 7–31% for the mutants we sampled (Table S4). The diradicaloid character for the LE form and the S1 state should not be taken literally (see section 2.3 for further discussion).
