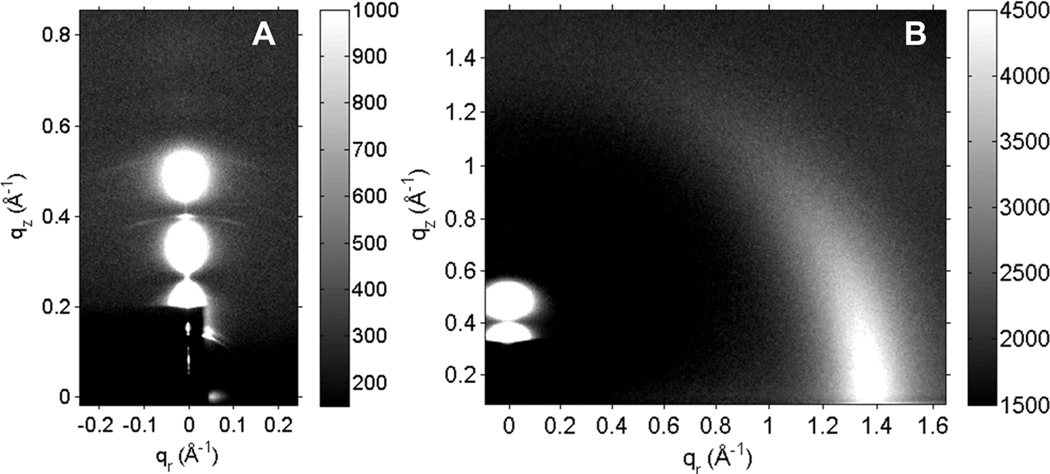
Fig. 2.
(A) LAXS and (B) WAXS data collected at CHESS at 37 °C of the G(−) IM mimic with 250 : 1 molar ratio lipid/WLBU2. In 2A, the beam stop (dark rectangle) covers the beam and the first and second lamellar orders. The thin, white vertical line in 2A is the X-ray reflectivity from the underlying silicon wafer. This sample is fully hydrated with a D-spacing of 85 Å. The faint arcs seen at ~0.4 Å−1 and ~0.5 Å−1 in qz are consistent with a second desiccated D-spacing of ~48 Å. In 2B, the chain correlation is the strong intensity centered qr ~1.4 Å−1. In 2B, the LAXS pattern is partially visible above the dark beam stop in the lower left hand corner.

