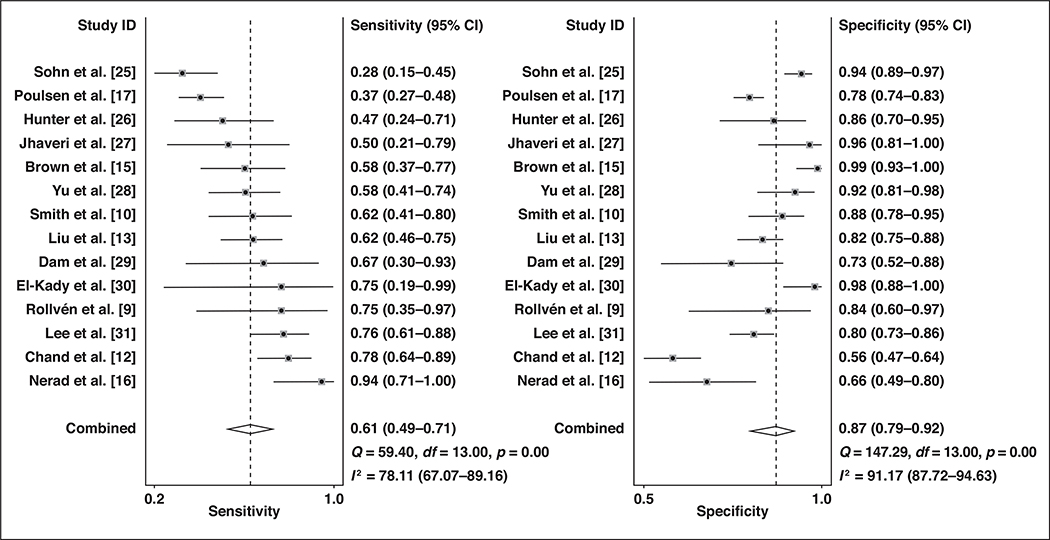
Fig. 4—
Coupled forest plots of pooled sensitivity and specificity. Numbers are pooled estimates (dots within squares) with 95% CIs (horizontal lines). Corresponding heterogeneity statistics are provided at bottom right corners. Dashed vertical lines and diamonds indicate overall meta-analytically pooled estimate. Lateral points of diamonds indicate CIs for estimate.

